1. Flow and WIP
Every job follows the same general flow through the shop between its release onto the floor and its shipment to the customer. At any moment every job in WIP sits somewhere in this flow, and its lead time, the working days from release to shipment, is the time it takes to pass through it.

In 2025, the shop carried an average of 238 WIP jobs against a throughput of about 19 shipped a day, so a job spent about 12 working days on the floor. 2025 WIP was skewed by the large Q1 backlog detailed below. WIP averaged 187 jobs over the past three years and peaks every December: 260 jobs in 2023, 466 in 2024 and 418 in 2025.

WIP peaked at 466 jobs at the end of 2024 against a Q3 2024 average of 150. In Q4 2024, the shop released 26% more brake standard hours than in Q3. This surge pushed the lasers to 92% of scheduled hours on average over the six weeks from November 18, vs. 69% in Q3. Over those weeks, 96 to 223 jobs were waiting to be cut, vs. an average of 35 jobs in Q3. The work then queued at the brakes, which already run at 90% in a normal quarter, and it took through Q1 and into Q2 2025 to clear this backlog. See Appendix Table 1 for additional detail.

By location, the brakes (queue, setup and run together) hold 28% of WIP in 2025, while the laser cutting stations hold 22% and outside processing 10%. The other eight work centers and jobs complete but not yet shipped hold the remaining 40% between them, none above 9%. In Q2-Q4 the brakes' share falls to 17% and the lasers' rises to 24%, as a result of the Q1 backlog having been worked through.

The 2025 average floor WIP of 238 jobs was 0.96x the WIP the quoted lead times imply at measured throughput; in Q2-Q4 it was 202 WIP jobs against 240 implied (0.84x). The excess for the year is a result of the first-quarter backlog. In Q2-Q4 the floor carried 38 fewer jobs than its quoted lead times allow at the throughput it achieved, so it could have taken on about 19% more work, or quoted shorter lead times, and still shipped the average job inside its quote. See Appendix Table 2 for additional detail.
2. Lead Time
Lead time decomposition
In 2025, the average lead time of all jobs was 12.8 days, and in Q2-Q4 it was 10.3 days. 84% of lead time in 2025 was spent waiting (movement between and queueing at work centers), against 6% spent working at machines (both setup and run), and 10% with outside vendors. The time spent waiting was concentrated: in 2025, the brake queue alone was 3.1 days of the average job's lead time (24% of total), and the brakes held 53% of all queue time. The brake queue time in 2025 was highly skewed: the median queue time was 1.0 day, with a 90th percentile of 9.5 days. We've presented Q2-Q4 data alongside 2025, as this largely removes the impact of the Q4 build and presents a more normalized view. See Appendix Table 3 for additional detail.

Actual vs. quoted lead times
In 2025, the median job shipped in 11.2 working days vs. an average quoted lead time of 12.9; in Q2-Q4, it was 9.2 vs. 12.5. The quoted lead time was met on 63% of jobs in 2025 and 77% in Q2-Q4. The quote was met on 59% of repeat-part jobs in 2025 (72% in Q2-Q4), 73% of new-part jobs (88%) and 72% of outside-processing jobs (90%). See Appendix Table 4 for additional detail.
The shop quotes lead times by starting with a routing class standard (10 working days for repeat parts, 15 for new parts and 20 with outside processing) which is then adjusted slightly based on current shop capacity and WIP levels. Section 4 analyzes the quote against the brake backlog.

3. On-time and Late Jobs
A job's due date is set as the later of the quote and the customer's requested date. Requested dates were 74% of job due dates in 2025, with a median of 15 working days. On-time delivery was 81% in 2025, and in Q2-Q4 once the backlog was worked through, on-time delivery was 91%.
There were 987 late jobs in 2025, with a median days late of 3 and a 90th percentile of 7. That dropped to 323 late jobs in Q2-Q4, with a median days late of 2 and a 90th percentile of 7. In 2025, 40% of jobs shipped 6 days or more before the due date. See Appendix Tables 5 and 6 for additional detail.

Late job lead time decomposition
In 2025, the brake queue was 24% of all jobs' lead time and accounted for the largest share of the extra days on late jobs: 5.76 days against 2.50 for on-time jobs. This was due to the first quarter's backlog: the 2024 year-end build released more work than the brakes could absorb and put 664 of the year's 987 late jobs into Q1. In Q2-Q4, with the backlog cleared, late jobs waited less at the brakes than on-time jobs (0.73 days against 1.54).
In Q2-Q4, the extra days on late jobs were due to material wait at the first operation (2.35 days for late jobs vs. 0.65 for on-time jobs), outside processing (2.24 vs. 1.17), the robotic weld queue (1.14 vs. 0.17) and setup and run (1.81 vs. 0.66; the average lot size for late jobs was 72 pieces vs. 47 for on-time jobs). See Appendix Tables 7a and 7b for additional detail.

Drivers behind late jobs
We analyzed the ERP and shop-floor records to arrive at an attribution of lost days (i.e., how many days late the jobs shipped) by driver. For each late job, we considered how many days it ran longer than an on-time job of the same routing class at each stage, as well as material holds and late purchase order receipts. We then assigned each job to a driver.
In 2025, jobs waiting at work centers (i.e., queue constraints) accounted for 42% of the 3,473 lost days, while jobs that were released late accounted for 21%, and jobs that waited on material and outside processing accounted for 7% and 3%, respectively. In Q2-Q4, jobs that were released late accounted for 48% of the 1,035 lost days, with queue constraint (16%), material (12%) and outside processing (3%) the other main drivers. Jobs were released late when they went to the floor with fewer working days to the due date than the job's quoted lead time; this was the largest driver on 162 of the 323 (50%) late jobs in Q2-Q4. See Appendix Tables 8, 9a and 9b for additional detail.

The chart below shows where on the floor the lost days were incurred: each work center's lost days in 2025 and in Q2-Q4, split by attributed driver. It excludes the days attributed to jobs released late (732 of the 3,473 lost days in 2025 and 501 of the 1,035 in Q2-Q4), since those days are lost at order entry, before the job reaches a work center.

24% of lost days in 2025 and 18% in Q2-Q4 have no attribution. Of the 823 non-attributed lost days in 2025, 27% was from work center queue time above on-time median but below the attribution threshold, 30% from setup and run time above normal with no overrun or rework recorded, and 16% from movement between stages. The remainder have no single discernible driver. See Appendix Tables 10 and 11 for additional detail.
The shop's own records
Late-reason codes are inputted retroactively on late jobs by the customer service team during the weekly delivery review. These codes are pulled from a dropdown list with six choices: capacity, material, outside processing, customer change, quality and other. As seen below, a significant portion of late jobs had no late-reason code entered (36% in 2025 and 37% in Q2-Q4). See Appendix Table 12 for additional detail.

To validate the accuracy of these codes, we compared them against the lost days attribution drivers shown above. We first mapped the late-reason codes to the corresponding attribution drivers: queue constraint and setup overrun count as capacity; material, outside processing and quality as their own codes; a hold and days not attributed as other. The notable exception is that the "released late" attribution driver is not a listed option for late-reason codes; those jobs are mostly coded as capacity or other (112 of the 149 with a code), and count as other in the comparison. We recommend adding this late-reason code into the system, given it accounts for a significant portion of lost days.
As shown below, the shop's entered reason-codes do not adequately capture the true drivers of lost days. The entered code agrees with the largest attributed cause on just 43.9% of coded late jobs against the 35.9% expected had the codes been assigned at random (34.7% against 25.1% in Q2-Q4). Queue constraint is the largest attributed driver on just 54% of the jobs coded capacity, while being misattributed across the rest (making up 50% of the jobs with no code and 19-76% of the other drivers). Material is the largest cause on just 21 of the 78 (27%) jobs coded material, outside processing on none of the 37 coded outside processing (0%) and quality on none of the 27 (0%) coded quality. Of the 241 jobs where released late is the largest attributed driver, 72 are coded capacity, 92 carry no code and 40 are coded other. See Appendix Tables 13 and 14 for additional detail.

To increase the accuracy and usefulness of its late-reason codes, the shop should consider process changes to (i) include additional options (specifically late releases) in the late-reason code dropdown menu, and (ii) enable real-time shop-floor data capture on the reasons for late jobs once they're known.
4. Quoting
The shop's quoted lead time was off by 4.8 days on average from 2023 to 2025. The current practice of quoting standard lead times based on the part's routing class, and then adjusting this higher during periods of low capacity, proved to be inaccurate in both directions.
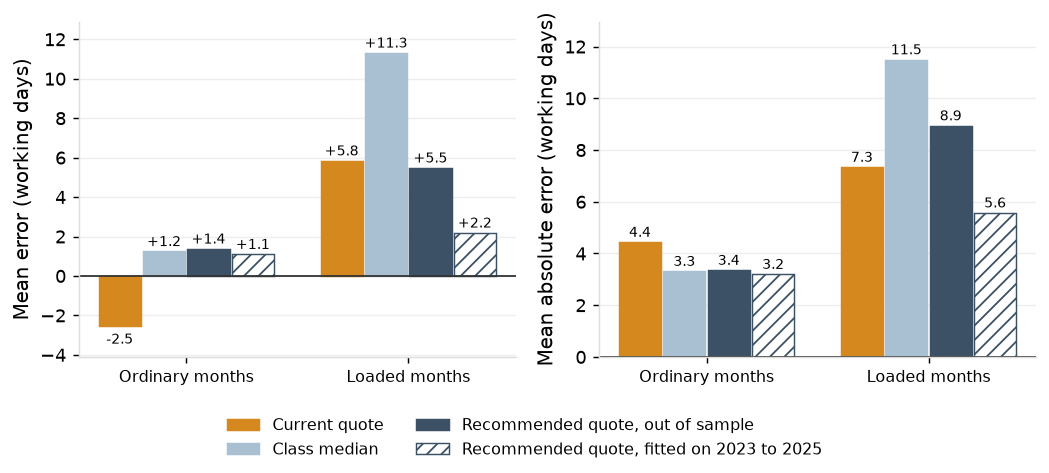
First, the fixed standards were consistently too high: in months of normal capacity, the shop over-estimated lead times by an average of 2.5 days. Second, during the period in Q4 2024 to Q1 2025 when the shop's capacity was constrained and lead times increased, the shop's lead time adjustments arrived too late and were too low in quantity, and so under-estimated lead times by 5.8 days in the four months from December 2024 to March 2025. See Appendix Table 15 for additional detail.

Brake backlog at release explains 23% of the lead time quoting error. The quote runs 3.1 days long below 1 day of backlog and 5.6 to 6.2 days short above 3. Outside processing quotes run 4.2 days long: the median job takes 14 days against the 20-day standard. Job size and lot size explain under 1%. The backlog at release sees a build late: jobs released in November 2024 ran 3.5 days over their quotes at 1.4 days of backlog. See Appendix Table 16 for additional detail.
Recommendation
The recommended quote is the median lead time of jobs of the same routing class at the same brake backlog at release, refitted monthly from the jobs shipped; the table below gives it as fitted on 2023 to 2025. Fitted that way, it misses by 3.2 days in ordinary months and 5.6 in the build, against 4.4 and 7.3 for today's quote, and quotes shorter than today on 84% of jobs, by 3.9 days on average, and longer on 14%, by 3.6. Applied month by month as the shop would have had it at the time, it does as well in ordinary months (3.4 days) but not in the 2024 build (8.9), because no earlier job had shipped from a backlog above 3 days. A median quote is met by about half of jobs; at the 80th percentile of the same cell the commitment is met on 82% of jobs, against 72% for today's quote. See Appendix Tables 17, 18 and 19 for additional detail.
| Routing class | Class standard | Class median | Under 1 day | 1 to 2 days | 2 to 3 days | 3 to 5 days | Over 5 days |
|---|---|---|---|---|---|---|---|
| Repeat part | 10 | 8 | 7 | 8 | 11 | 16 | 18 |
| New part | 15 | 9 | 8 | 10 | 15 | 21 | 22 |
| Outside processing | 20 | 14 | 13 | 14 | 20 | 29 | 26 |

Appendix
Table 1. Year-end WIP build by year
| Year | Third-quarter mean WIP | December peak WIP | Peak date | Peak over third-quarter mean | On time, following first quarter | Median lead time, following first quarter |
|---|---|---|---|---|---|---|
| 2023 | 126 | 260 | Dec 22 | 2.1 | 93.2% | 8.2 |
| 2024 | 150 | 466 | Dec 23 | 3.1 | 52.4% | 19.2 |
| 2025 | 189 | 418 | Dec 23 | 2.2 |
Table 2. Floor WIP against the WIP the quoted lead times imply
| Period | Working days | Jobs shipped | Mean WIP | Jobs shipped per day | Mean quoted lead time | WIP at quoted lead times | Ratio | WIP over throughput (days) | Mean days in WIP | Mean lead time |
|---|---|---|---|---|---|---|---|---|---|---|
| 2025 | 266 | 5,129 | 238 | 19.28 | 12.90 | 249 | 0.96 | 12.35 | 12.57 | 12.78 |
| 2025 Q2-Q4 | 194 | 3,734 | 202 | 19.25 | 12.48 | 240 | 0.84 | 10.52 | 10.08 | 10.29 |
Table 3. Queue time by work center
| Work center | Operations | Queue days | Share | Mean | Median | 90th percentile | Share, Q2-Q4 | Mean, Q2-Q4 | Median, Q2-Q4 | 90th percentile, Q2-Q4 |
|---|---|---|---|---|---|---|---|---|---|---|
| Press brake | 5,566 | 17,013 | 53.2% | 3.06 | 1.02 | 9.51 | 35.3% | 1.48 | 0.55 | 4.13 |
| Grind and deburr | 5,572 | 4,902 | 15.3% | 0.88 | 0.80 | 1.87 | 21.4% | 0.89 | 0.81 | 1.88 |
| Inspection and pack | 5,129 | 3,526 | 11.0% | 0.69 | 0.79 | 1.07 | 16.1% | 0.74 | 0.82 | 1.06 |
| Hardware | 2,118 | 1,748 | 5.5% | 0.83 | 0.71 | 1.70 | 7.6% | 0.84 | 0.72 | 1.63 |
| Manual weld | 1,533 | 1,328 | 4.1% | 0.87 | 0.72 | 1.81 | 5.0% | 0.76 | 0.73 | 1.44 |
| Robotic weld | 420 | 1,207 | 3.8% | 2.87 | 1.19 | 7.94 | 5.7% | 3.21 | 1.27 | 9.09 |
| Powder coat | 2,328 | 1,163 | 3.6% | 0.50 | 0.10 | 1.90 | 4.3% | 0.43 | 0.09 | 1.70 |
| Assembly | 684 | 1,115 | 3.5% | 1.63 | 0.86 | 4.01 | 4.6% | 1.53 | 0.85 | 3.76 |
Table 4. Lead time against the quoted lead time by routing class
| Period | Routing class | Jobs | Quoted | Median | Mean | 90th percentile | Within quoted | On time | Late jobs | Median, on time | Median, late |
|---|---|---|---|---|---|---|---|---|---|---|---|
| 2025 | All | 5,129 | 12.9 | 11.2 | 12.8 | 23.2 | 63.0% | 80.8% | 987 | 9.2 | 19.2 |
| 2025 | Repeat part | 3,698 | 10.6 | 9.2 | 11.4 | 21.2 | 59.2% | 82.2% | 659 | 8.2 | 17.2 |
| 2025 | New part | 462 | 15.5 | 11.2 | 12.8 | 23.2 | 73.4% | 82.5% | 81 | 10.2 | 22.2 |
| 2025 | Outside processing | 969 | 20.5 | 16.2 | 18.2 | 30.2 | 72.4% | 74.5% | 247 | 14.2 | 27.2 |
| 2025 Q2-Q4 | All | 3,734 | 12.5 | 9.2 | 10.3 | 17.2 | 76.8% | 91.3% | 323 | 9.2 | 13.2 |
| 2025 Q2-Q4 | Repeat part | 2,678 | 10.1 | 8.2 | 9.0 | 15.2 | 71.8% | 91.9% | 218 | 7.2 | 12.2 |
| 2025 Q2-Q4 | New part | 346 | 15.1 | 10.2 | 10.5 | 16.7 | 88.4% | 93.1% | 24 | 10.2 | 16.7 |
| 2025 Q2-Q4 | Outside processing | 710 | 20.1 | 14.2 | 15.2 | 21.2 | 89.7% | 88.6% | 81 | 14.2 | 22.2 |
Table 5. On-time delivery and lead time by quarter shipped
| Quarter shipped | Jobs shipped | Late jobs | On time | Median lead time | 90th percentile |
|---|---|---|---|---|---|
| 2023 Q1 | 1,188 | 87 | 92.7% | 9.2 | 22.2 |
| 2023 Q2 | 1,042 | 54 | 94.8% | 7.2 | 13.2 |
| 2023 Q3 | 981 | 69 | 93.0% | 7.2 | 14.2 |
| 2023 Q4 | 1,131 | 90 | 92.0% | 8.2 | 16.2 |
| 2024 Q1 | 1,216 | 83 | 93.2% | 8.2 | 16.2 |
| 2024 Q2 | 1,106 | 65 | 94.1% | 7.2 | 14.2 |
| 2024 Q3 | 1,060 | 81 | 92.4% | 8.2 | 16.2 |
| 2024 Q4 | 1,171 | 142 | 87.9% | 9.2 | 18.2 |
| 2025 Q1 | 1,395 | 664 | 52.4% | 19.2 | 31.2 |
| 2025 Q2 | 1,315 | 81 | 93.8% | 9.2 | 17.2 |
| 2025 Q3 | 1,186 | 118 | 90.1% | 9.2 | 17.2 |
| 2025 Q4 | 1,233 | 124 | 89.9% | 9.2 | 17.2 |
Table 6. Jobs shipped by working days from the due date to the ship date, 2025 and Q2-Q4
| Working days from the due date to the ship date | Jobs shipped, 2025 | Jobs shipped, 2025 Q2-Q4 |
|---|---|---|
| 10 or more early | 802 | 763 |
| 9 early | 227 | 222 |
| 8 early | 287 | 269 |
| 7 early | 350 | 321 |
| 6 early | 390 | 348 |
| 5 early | 395 | 351 |
| 4 early | 367 | 324 |
| 3 early | 341 | 273 |
| 2 early | 362 | 249 |
| 1 early | 322 | 163 |
| on the due date | 299 | 128 |
| 1 late | 266 | 97 |
| 2 late | 201 | 72 |
| 3 late | 135 | 52 |
| 4 late | 108 | 31 |
| 5 late | 79 | 22 |
| 6 late | 63 | 14 |
| 7 late | 43 | 8 |
| 8 late | 31 | 10 |
| 9 late | 24 | 5 |
| 10 or more late | 37 | 12 |
| All jobs | 5,129 | 3,734 |
Table 7a. Lead time by stage, 2025: mean working days per job, stages in routing order
| Stage | All jobs | Share of lead time | On time | Late |
|---|---|---|---|---|
| Release to traveler print | 0.90 | 7.1% | 0.89 | 0.97 |
| First-operation queue | 1.48 | 11.6% | 1.08 | 3.16 |
| Material wait at first operation | 0.85 | 6.6% | 0.68 | 1.55 |
| Queue: press brake | 3.13 | 24.5% | 2.50 | 5.76 |
| Queue: hardware | 0.22 | 1.7% | 0.23 | 0.18 |
| Queue: manual weld | 0.19 | 1.5% | 0.18 | 0.21 |
| Queue: robotic weld | 0.23 | 1.8% | 0.15 | 0.58 |
| Queue: grind and deburr | 0.66 | 5.2% | 0.68 | 0.58 |
| Powder scheduling wait | 0.46 | 3.6% | 0.40 | 0.73 |
| Queue: powder coat | 0.16 | 1.3% | 0.13 | 0.33 |
| Queue: assembly | 0.20 | 1.6% | 0.12 | 0.54 |
| Queue: inspection and pack | 0.51 | 4.0% | 0.59 | 0.19 |
| Setup and run | 0.82 | 6.4% | 0.67 | 1.47 |
| Move | 0.79 | 6.2% | 0.74 | 1.03 |
| Hold: customer | 0.09 | 0.7% | 0.08 | 0.13 |
| Hold: engineering | 0.06 | 0.5% | 0.05 | 0.09 |
| Hold: material | 0.01 | 0.0% | 0.00 | 0.01 |
| Hold: other | 0.03 | 0.2% | 0.03 | 0.03 |
| Hold: quality | 0.04 | 0.3% | 0.03 | 0.06 |
| Hold: tooling | 0.03 | 0.2% | 0.03 | 0.04 |
| Outside processing | 1.27 | 9.9% | 1.10 | 1.96 |
| Packed, waiting to ship | 0.67 | 5.3% | 0.63 | 0.84 |
| Lead time, mean | 12.78 | 10.97 | 20.38 | |
| Lead time, median | 11.2 | 9.2 | 19.2 | |
| Jobs | 5,129 | 4,142 | 987 |
Table 7b. Lead time by stage, 2025 Q2-Q4: mean working days per job, stages in routing order
| Stage | All jobs | Share of lead time | On time | Late |
|---|---|---|---|---|
| Release to traveler print | 0.87 | 8.5% | 0.87 | 0.86 |
| First-operation queue | 0.83 | 8.1% | 0.85 | 0.62 |
| Material wait at first operation | 0.80 | 7.8% | 0.65 | 2.35 |
| Queue: press brake | 1.47 | 14.3% | 1.54 | 0.73 |
| Queue: hardware | 0.23 | 2.2% | 0.23 | 0.18 |
| Queue: manual weld | 0.16 | 1.5% | 0.16 | 0.14 |
| Queue: robotic weld | 0.25 | 2.4% | 0.17 | 1.14 |
| Queue: grind and deburr | 0.68 | 6.6% | 0.70 | 0.45 |
| Powder scheduling wait | 0.44 | 4.3% | 0.41 | 0.74 |
| Queue: powder coat | 0.13 | 1.3% | 0.13 | 0.18 |
| Queue: assembly | 0.19 | 1.8% | 0.14 | 0.74 |
| Queue: inspection and pack | 0.56 | 5.5% | 0.61 | 0.08 |
| Setup and run | 0.76 | 7.4% | 0.66 | 1.81 |
| Move | 0.78 | 7.6% | 0.75 | 1.20 |
| Hold: customer | 0.08 | 0.8% | 0.08 | 0.13 |
| Hold: engineering | 0.06 | 0.6% | 0.06 | 0.11 |
| Hold: material | 0.01 | 0.1% | 0.01 | 0.02 |
| Hold: other | 0.03 | 0.3% | 0.03 | 0.05 |
| Hold: quality | 0.04 | 0.4% | 0.04 | 0.06 |
| Hold: tooling | 0.03 | 0.3% | 0.03 | 0.04 |
| Outside processing | 1.26 | 12.3% | 1.17 | 2.24 |
| Packed, waiting to ship | 0.65 | 6.3% | 0.63 | 0.91 |
| Lead time, mean | 10.29 | 9.87 | 14.74 | |
| Lead time, median | 9.2 | 9.2 | 13.2 | |
| Jobs | 3,734 | 3,411 | 323 |
Table 8. Lost days of late jobs by attributed cause, 2025 and Q2-Q4
| Cause | Lost days, 2025 | Share | Late jobs with the cause | Jobs where largest | Lost days, Q2-Q4 | Share, Q2-Q4 | Late jobs with the cause, Q2-Q4 | Jobs where largest, Q2-Q4 |
|---|---|---|---|---|---|---|---|---|
| Queue constraint | 1,466 | 42.2% | 687 | 499 | 164 | 15.9% | 130 | 62 |
| Released late | 732 | 21.1% | 252 | 241 | 501 | 48.4% | 166 | 162 |
| Material | 241 | 6.9% | 216 | 84 | 126 | 12.2% | 103 | 51 |
| Outside processing | 101 | 2.9% | 64 | 10 | 27 | 2.6% | 25 | 6 |
| Setup overrun | 12 | 0.3% | 28 | 1 | 2 | 0.1% | 5 | 0 |
| Quality | 47 | 1.4% | 83 | 3 | 16 | 1.6% | 24 | 1 |
| Hold | 52 | 1.5% | 102 | 0 | 11 | 1.0% | 20 | 0 |
| Not attributed | 823 | 23.7% | 784 | 149 | 188 | 18.2% | 193 | 41 |
| Total | 3,473 | 100.0% | 987 | 987 | 1,035 | 100.0% | 323 | 323 |
Table 9a. Lost days by work center and cause, 2025
| Work center | Lost days | Share | Queue constraint | Released late | Material | Outside processing | Setup overrun | Quality | Hold | Not attributed |
|---|---|---|---|---|---|---|---|---|---|---|
| Laser | 881 | 25.4% | 538 | 0 | 190 | 0 | 1 | 8 | 10 | 134 |
| Order entry (promise) | 732 | 21.1% | 0 | 732 | 0 | 0 | 0 | 0 | 0 | 0 |
| Press brake | 638 | 18.4% | 450 | 0 | 0 | 0 | 4 | 8 | 10 | 166 |
| Assembly | 191 | 5.5% | 131 | 0 | 0 | 0 | 1 | 3 | 0 | 56 |
| Robotic weld | 161 | 4.6% | 116 | 0 | 0 | 0 | 2 | 2 | 1 | 41 |
| Grind and deburr | 141 | 4.0% | 43 | 0 | 0 | 0 | 0 | 1 | 11 | 86 |
| Punch | 136 | 3.9% | 53 | 0 | 49 | 0 | 1 | 0 | 1 | 32 |
| Outside processing | 132 | 3.8% | 0 | 0 | 0 | 101 | 0 | 1 | 3 | 26 |
| Manual weld | 124 | 3.6% | 21 | 0 | 0 | 0 | 1 | 16 | 0 | 86 |
| Powder coat | 100 | 2.9% | 79 | 0 | 0 | 0 | 0 | 0 | 6 | 15 |
| Shipping | 96 | 2.8% | 0 | 0 | 0 | 0 | 0 | 0 | 0 | 96 |
| Hardware | 74 | 2.1% | 21 | 0 | 1 | 0 | 0 | 4 | 4 | 44 |
| Inspection and pack | 68 | 1.9% | 13 | 0 | 0 | 0 | 0 | 4 | 7 | 42 |
Table 9b. Lost days by work center and cause, 2025 Q2-Q4
| Work center | Lost days | Share | Queue constraint | Released late | Material | Outside processing | Setup overrun | Quality | Hold | Not attributed |
|---|---|---|---|---|---|---|---|---|---|---|
| Order entry (promise) | 501 | 48.4% | 0 | 501 | 0 | 0 | 0 | 0 | 0 | 0 |
| Laser | 135 | 13.1% | 11 | 0 | 106 | 0 | 0 | 4 | 2 | 12 |
| Robotic weld | 86 | 8.3% | 63 | 0 | 0 | 0 | 0 | 0 | 0 | 22 |
| Assembly | 50 | 4.9% | 33 | 0 | 0 | 0 | 0 | 0 | 0 | 17 |
| Press brake | 45 | 4.3% | 23 | 0 | 0 | 0 | 1 | 1 | 0 | 20 |
| Manual weld | 43 | 4.2% | 4 | 0 | 0 | 0 | 0 | 7 | 0 | 31 |
| Punch | 41 | 3.9% | 14 | 0 | 20 | 0 | 0 | 0 | 1 | 5 |
| Grind and deburr | 35 | 3.4% | 4 | 0 | 0 | 0 | 0 | 0 | 4 | 26 |
| Outside processing | 34 | 3.3% | 0 | 0 | 0 | 27 | 0 | 0 | 0 | 7 |
| Shipping | 23 | 2.2% | 0 | 0 | 0 | 0 | 0 | 0 | 0 | 23 |
| Hardware | 18 | 1.7% | 3 | 0 | 0 | 0 | 0 | 1 | 1 | 13 |
| Powder coat | 13 | 1.3% | 9 | 0 | 0 | 0 | 0 | 0 | 0 | 4 |
| Inspection and pack | 11 | 1.0% | 0 | 0 | 0 | 0 | 0 | 1 | 1 | 8 |
Table 10. Stage composition of the lost days not attributed
| Stage | Days not attributed, 2025 | Share | Days not attributed, Q2-Q4 | Share, Q2-Q4 |
|---|---|---|---|---|
| Setup and run | 248 | 30.1% | 92 | 49.0% |
| Move | 132 | 16.0% | 35 | 18.8% |
| Queue: press brake | 108 | 13.2% | 2 | 1.0% |
| Packed, waiting to ship | 96 | 11.7% | 23 | 12.1% |
| Material wait at first operation | 61 | 7.4% | 3 | 1.3% |
| First-operation queue | 36 | 4.3% | 1 | 0.3% |
| Release to traveler print | 31 | 3.8% | 1 | 0.6% |
| Outside processing | 26 | 3.2% | 6 | 3.4% |
| Queue: robotic weld | 20 | 2.5% | 12 | 6.6% |
| Queue: hardware | 17 | 2.0% | 5 | 2.4% |
| Queue: assembly | 14 | 1.7% | 1 | 0.7% |
| Queue: grind and deburr | 14 | 1.7% | 2 | 1.0% |
| Queue: manual weld | 9 | 1.1% | 3 | 1.6% |
| Hold: other | 6 | 0.8% | 2 | 1.1% |
| Queue: inspection and pack | 3 | 0.3% | 0 | 0.0% |
| Queue: powder coat | 1 | 0.1% | 0 | 0.0% |
| Total | 823 | 100.0% | 188 | 100.0% |
Table 11. Queue constraint and not attributed shares by queue threshold
| Queue threshold of the constraint rule | Queue constraint, 2025 | Not attributed, 2025 | Queue constraint, Q2-Q4 | Not attributed, Q2-Q4 |
|---|---|---|---|---|
| 70th percentile (the rule) | 42.2% | 23.7% | 15.9% | 18.2% |
| 80th percentile | 34.9% | 31.0% | 13.4% | 20.7% |
| 90th percentile | 21.4% | 44.5% | 9.4% | 24.6% |
Table 12. Late-reason codes by period shipped
| Period shipped | Late jobs | Blank | Capacity share of entered codes |
|---|---|---|---|
| 2023 | 300 | 39.0% | 48.1% |
| 2024 | 371 | 33.4% | 59.5% |
| 2025 | 987 | 36.4% | 60.5% |
| 2025 Q2-Q4 | 323 | 37.5% | 55.0% |
Table 13. Agreement of the entered code with the largest attributed cause
| Comparison | Period | Late jobs | Code agrees with largest attributed cause | Chance level | Over chance |
|---|---|---|---|---|---|
| All coded late jobs | 2025 | 628 | 43.9% | 35.9% | +8.0 points |
| All coded late jobs | 2025 Q2-Q4 | 202 | 34.7% | 25.1% | +9.5 points |
| Jobs whose largest cause has a code | 2025 | 383 | 59.0% | 54.7% | +4.3 points |
| Jobs whose largest cause has a code | 2025 Q2-Q4 | 75 | 48.0% | 44.1% | +3.9 points |
Table 14. Entered code against largest attributed cause, 2025
| Code entered | Queue constraint | Released late | Material | Outside processing | Setup overrun | Quality | Hold | Not attributed |
|---|---|---|---|---|---|---|---|---|
| Capacity | 204 | 72 | 30 | 4 | 1 | 2 | 0 | 67 |
| Material | 34 | 16 | 21 | 1 | 0 | 0 | 0 | 6 |
| Outside processing | 21 | 10 | 1 | 0 | 0 | 0 | 0 | 5 |
| Customer change | 32 | 3 | 2 | 0 | 0 | 0 | 0 | 5 |
| Quality | 15 | 8 | 1 | 0 | 0 | 0 | 0 | 3 |
| Other | 12 | 40 | 2 | 0 | 0 | 0 | 0 | 10 |
| Blank | 181 | 92 | 27 | 5 | 0 | 1 | 0 | 53 |
Table 15. The current quote against actual lead time by period and routing class, non-rush jobs released 2023 to 2025
| Period, by release date | Routing class | Jobs | Mean actual lead time | Mean quoted lead time | Mean error | Mean absolute error | Within 2 days | Mean brake backlog at release |
|---|---|---|---|---|---|---|---|---|
| 2023 to 2025 | All | 10,996 | 11.13 | 12.64 | -1.51 | 4.78 | 27.8% | 1.27 |
| 2023 to 2025 | Repeat part | 7,836 | 9.79 | 10.22 | -0.43 | 4.20 | 32.4% | 1.29 |
| 2023 to 2025 | New part | 976 | 11.02 | 15.18 | -4.15 | 6.13 | 15.6% | 1.20 |
| 2023 to 2025 | Outside processing | 2,184 | 15.97 | 20.16 | -4.20 | 6.27 | 17.1% | 1.25 |
| 2023 | All | 3,458 | 9.19 | 12.50 | -3.31 | 4.63 | 26.0% | 0.55 |
| 2023 | Repeat part | 2,438 | 7.88 | 10.00 | -2.12 | 3.80 | 31.4% | 0.55 |
| 2023 | New part | 312 | 8.65 | 15.00 | -6.35 | 6.79 | 9.9% | 0.54 |
| 2023 | Outside processing | 708 | 13.93 | 20.00 | -6.07 | 6.53 | 14.7% | 0.54 |
| 2024 | All | 3,817 | 11.38 | 12.48 | -1.10 | 5.20 | 26.1% | 0.96 |
| 2024 | Repeat part | 2,708 | 9.97 | 10.02 | -0.05 | 4.62 | 30.5% | 0.96 |
| 2024 | New part | 338 | 11.56 | 15.00 | -3.44 | 6.50 | 15.1% | 0.97 |
| 2024 | Outside processing | 771 | 16.27 | 20.02 | -3.75 | 6.69 | 15.7% | 0.96 |
| 2025 | All | 3,721 | 12.66 | 12.92 | -0.26 | 4.50 | 31.3% | 2.27 |
| 2025 | Repeat part | 2,690 | 11.34 | 10.62 | +0.71 | 4.15 | 35.2% | 2.29 |
| 2025 | New part | 326 | 12.74 | 15.54 | -2.80 | 5.11 | 21.5% | 2.06 |
| 2025 | Outside processing | 705 | 17.68 | 20.49 | -2.81 | 5.55 | 21.1% | 2.28 |
| 2025 Q2-Q4 | All | 2,793 | 10.73 | 12.38 | -1.65 | 4.01 | 33.7% | 1.17 |
| 2025 Q2-Q4 | Repeat part | 2,001 | 9.44 | 10.01 | -0.57 | 3.51 | 38.4% | 1.16 |
| 2025 Q2-Q4 | New part | 260 | 10.94 | 15.02 | -4.08 | 5.00 | 21.5% | 1.16 |
| 2025 Q2-Q4 | Outside processing | 532 | 15.46 | 20.00 | -4.54 | 5.42 | 22.0% | 1.19 |
| Loaded months | All | 1,322 | 19.78 | 13.95 | +5.84 | 7.34 | 19.5% | 4.77 |
| Loaded months | Repeat part | 971 | 17.95 | 11.76 | +6.19 | 7.39 | 21.2% | 4.78 |
| Loaded months | New part | 106 | 21.10 | 16.60 | +4.50 | 6.56 | 17.0% | 4.57 |
| Loaded months | Outside processing | 245 | 26.47 | 21.47 | +5.00 | 7.47 | 13.9% | 4.81 |
| Ordinary months | All | 9,674 | 9.94 | 12.46 | -2.51 | 4.44 | 29.0% | 0.80 |
| Ordinary months | Repeat part | 6,865 | 8.63 | 10.00 | -1.37 | 3.75 | 33.9% | 0.80 |
| Ordinary months | New part | 870 | 9.80 | 15.01 | -5.21 | 6.08 | 15.4% | 0.79 |
| Ordinary months | Outside processing | 1,939 | 14.64 | 20.00 | -5.36 | 6.12 | 17.5% | 0.80 |
10,996 non-rush jobs released from January 2023 and shipped by December 2025. Left out: 254 released before January 2023, which the record holds only where they shipped late, and 834 lines customer service accepted inside the quote. Error is the actual lead time less the quoted lead time in whole working days; a loaded month has a mean brake backlog at release of 2.5 days or more.
Table 16. Quote error by condition at release, non-rush jobs released 2023 to 2025
Each condition alone
| Condition at release | Variance in quote error explained alone | Mean error, lowest band | Mean error, highest band |
|---|---|---|---|
| Brake backlog at release (days) | 22.9% | -3.10 (under 1) | +5.65 (over 5) |
| Brake standard hours on the job (quartiles) | 0.6% | -1.94 ((0.524, 1.001]) | -0.79 ((2.845, 71.245]) |
| Lot size (quartiles) | 0.4% | -1.77 ((0.999, 11.0]) | -0.85 ((56.0, 500.0]) |
| Operations on the routing | 1.8% | -2.66 (3) | -0.19 (8) |
| Outside processing on the routing | 5.2% | -0.85 (no) | -4.20 (yes) |
| Release month of the year | 14.7% | +1.49 (1) | +4.60 (12) |
Brake backlog at release (days)
| Band | Jobs | Mean actual lead time | Mean quoted lead time | Mean error | Mean absolute error |
|---|---|---|---|---|---|
| under 1 | 6,655 | 9.34 | 12.44 | -3.10 | 4.56 |
| 1 to 2 | 2,557 | 10.89 | 12.50 | -1.61 | 4.09 |
| 2 to 3 | 795 | 15.51 | 12.50 | +3.01 | 6.10 |
| 3 to 5 | 354 | 19.65 | 13.49 | +6.16 | 8.12 |
| over 5 | 635 | 20.61 | 14.96 | +5.65 | 6.46 |
Brake standard hours on the job (quartiles)
| Band | Jobs | Mean actual lead time | Mean quoted lead time | Mean error | Mean absolute error |
|---|---|---|---|---|---|
| (0.524, 1.001] | 2,749 | 10.82 | 12.75 | -1.94 | 4.84 |
| (1.001, 1.578] | 2,749 | 11.00 | 12.74 | -1.74 | 4.88 |
| (1.578, 2.845] | 2,749 | 10.88 | 12.45 | -1.57 | 4.77 |
| (2.845, 71.245] | 2,749 | 11.81 | 12.60 | -0.79 | 4.65 |
Lot size (quartiles)
| Band | Jobs | Mean actual lead time | Mean quoted lead time | Mean error | Mean absolute error |
|---|---|---|---|---|---|
| (0.999, 11.0] | 2,864 | 10.89 | 12.67 | -1.77 | 4.80 |
| (11.0, 25.0] | 2,757 | 10.88 | 12.60 | -1.72 | 4.81 |
| (25.0, 56.0] | 2,635 | 10.90 | 12.60 | -1.69 | 4.81 |
| (56.0, 500.0] | 2,740 | 11.83 | 12.68 | -0.85 | 4.72 |
Operations on the routing
| Band | Jobs | Mean actual lead time | Mean quoted lead time | Mean error | Mean absolute error |
|---|---|---|---|---|---|
| 3 | 278 | 8.17 | 10.83 | -2.66 | 5.88 |
| 4 | 1,367 | 9.10 | 11.80 | -2.71 | 5.18 |
| 5 | 3,682 | 10.24 | 12.26 | -2.02 | 4.84 |
| 6 | 2,635 | 11.46 | 12.67 | -1.21 | 4.67 |
| 7 | 1,882 | 12.30 | 13.01 | -0.70 | 4.47 |
| 8 | 1,152 | 14.39 | 14.58 | -0.19 | 4.66 |
Outside processing on the routing
| Band | Jobs | Mean actual lead time | Mean quoted lead time | Mean error | Mean absolute error |
|---|---|---|---|---|---|
| no | 8,812 | 9.92 | 10.77 | -0.85 | 4.42 |
| yes | 2,184 | 15.97 | 20.16 | -4.20 | 6.27 |
Release month of the year
| Band | Jobs | Mean actual lead time | Mean quoted lead time | Mean error | Mean absolute error |
|---|---|---|---|---|---|
| 1 | 835 | 14.71 | 13.22 | +1.49 | 5.07 |
| 2 | 879 | 12.98 | 13.61 | -0.64 | 5.47 |
| 3 | 889 | 9.95 | 13.07 | -3.12 | 4.61 |
| 4 | 933 | 9.10 | 12.41 | -3.31 | 4.48 |
| 5 | 937 | 9.36 | 12.51 | -3.14 | 4.30 |
| 6 | 990 | 9.92 | 12.51 | -2.59 | 4.23 |
| 7 | 817 | 8.93 | 12.31 | -3.38 | 4.67 |
| 8 | 843 | 10.28 | 12.15 | -1.86 | 4.30 |
| 9 | 989 | 10.44 | 12.49 | -2.05 | 4.23 |
| 10 | 1,087 | 9.40 | 12.50 | -3.10 | 4.42 |
| 11 | 1,013 | 12.70 | 12.51 | +0.19 | 4.85 |
| 12 | 784 | 17.02 | 12.42 | +4.60 | 7.32 |
Table 17. Every quote tested: error by period, change from the current quote, and how each quote was reached
Error by period
| Quote | Period, by release date | Jobs | Mean error | Mean absolute error | Within 2 days | Mean quote |
|---|---|---|---|---|---|---|
| Current quote | 2023 to 2025 | 10,996 | -1.51 | 4.78 | 27.8% | 12.64 |
| Current quote | 2023 | 3,458 | -3.31 | 4.63 | 26.0% | 12.50 |
| Current quote | 2024 | 3,817 | -1.10 | 5.20 | 26.1% | 12.48 |
| Current quote | 2025 | 3,721 | -0.26 | 4.50 | 31.3% | 12.92 |
| Current quote | 2025 Q2-Q4 | 2,793 | -1.65 | 4.01 | 33.7% | 12.38 |
| Current quote | Loaded months | 1,322 | +5.84 | 7.34 | 19.5% | 13.95 |
| Current quote | Ordinary months | 9,674 | -2.51 | 4.44 | 29.0% | 12.46 |
| Class median | 2023 to 2025 | 10,996 | +2.45 | 4.29 | 46.2% | 8.67 |
| Class median | 2023 | 3,458 | +0.53 | 3.17 | 50.8% | 8.66 |
| Class median | 2024 | 3,817 | +3.09 | 4.60 | 47.5% | 8.29 |
| Class median | 2025 | 3,721 | +3.58 | 5.03 | 40.5% | 9.08 |
| Class median | 2025 Q2-Q4 | 2,793 | +1.49 | 3.34 | 49.2% | 9.24 |
| Class median | Loaded months | 1,322 | +11.31 | 11.49 | 11.0% | 8.48 |
| Class median | Ordinary months | 9,674 | +1.24 | 3.31 | 51.0% | 8.70 |
| Class and brake backlog, out of sample | 2023 to 2025 | 10,996 | +1.86 | 4.02 | 47.7% | 9.26 |
| Class and brake backlog, out of sample | 2023 | 3,458 | +0.97 | 3.17 | 53.6% | 8.22 |
| Class and brake backlog, out of sample | 2024 | 3,817 | +2.92 | 4.36 | 48.6% | 8.46 |
| Class and brake backlog, out of sample | 2025 | 3,721 | +1.61 | 4.48 | 41.3% | 11.05 |
| Class and brake backlog, out of sample | 2025 Q2-Q4 | 2,793 | +1.38 | 3.57 | 47.5% | 9.35 |
| Class and brake backlog, out of sample | Loaded months | 1,322 | +5.48 | 8.94 | 17.8% | 14.31 |
| Class and brake backlog, out of sample | Ordinary months | 9,674 | +1.37 | 3.35 | 51.8% | 8.57 |
| Class and brake backlog, fitted on 2023 to 2025 | 2023 to 2025 | 10,996 | +1.23 | 3.48 | 49.6% | 9.90 |
| Class and brake backlog, fitted on 2023 to 2025 | 2023 | 3,458 | +0.65 | 2.92 | 53.2% | 8.54 |
| Class and brake backlog, fitted on 2023 to 2025 | 2024 | 3,817 | +1.89 | 3.75 | 50.2% | 9.49 |
| Class and brake backlog, fitted on 2023 to 2025 | 2025 | 3,721 | +1.08 | 3.72 | 45.7% | 11.58 |
| Class and brake backlog, fitted on 2023 to 2025 | 2025 Q2-Q4 | 2,793 | +1.48 | 3.47 | 48.4% | 9.24 |
| Class and brake backlog, fitted on 2023 to 2025 | Loaded months | 1,322 | +2.18 | 5.57 | 33.1% | 17.60 |
| Class and brake backlog, fitted on 2023 to 2025 | Ordinary months | 9,674 | +1.09 | 3.19 | 51.9% | 8.85 |
| Class, brake backlog and brake standard hours, out of sample | 2023 to 2025 | 10,996 | +1.80 | 4.01 | 47.9% | 9.33 |
| Class, brake backlog and brake standard hours, out of sample | 2023 | 3,458 | +0.78 | 3.13 | 53.5% | 8.41 |
| Class, brake backlog and brake standard hours, out of sample | 2024 | 3,817 | +2.97 | 4.32 | 49.4% | 8.41 |
| Class, brake backlog and brake standard hours, out of sample | 2025 | 3,721 | +1.54 | 4.51 | 41.1% | 11.12 |
| Class, brake backlog and brake standard hours, out of sample | 2025 Q2-Q4 | 2,793 | +1.31 | 3.60 | 47.2% | 9.42 |
| Class, brake backlog and brake standard hours, out of sample | Loaded months | 1,322 | +5.38 | 8.94 | 17.9% | 14.40 |
| Class, brake backlog and brake standard hours, out of sample | Ordinary months | 9,674 | +1.31 | 3.33 | 52.0% | 8.63 |
| Class, brake backlog and lot size, out of sample | 2023 to 2025 | 10,996 | +1.82 | 4.02 | 47.7% | 9.30 |
| Class, brake backlog and lot size, out of sample | 2023 | 3,458 | +0.82 | 3.14 | 53.2% | 8.37 |
| Class, brake backlog and lot size, out of sample | 2024 | 3,817 | +3.01 | 4.33 | 49.4% | 8.37 |
| Class, brake backlog and lot size, out of sample | 2025 | 3,721 | +1.54 | 4.51 | 41.0% | 11.12 |
| Class, brake backlog and lot size, out of sample | 2025 Q2-Q4 | 2,793 | +1.32 | 3.60 | 47.1% | 9.41 |
| Class, brake backlog and lot size, out of sample | Loaded months | 1,322 | +5.36 | 8.95 | 17.8% | 14.43 |
| Class, brake backlog and lot size, out of sample | Ordinary months | 9,674 | +1.34 | 3.34 | 51.8% | 8.60 |
Against the current quote, 2023 to 2025
| Quote | Shorter than the current quote | Shorter by, days (mean) | Longer | Longer by, days (mean) | Same |
|---|---|---|---|---|---|
| Class median | 96.6% | 4.10 | 0.0% | 3.4% | |
| Class and brake backlog, out of sample | 88.4% | 4.17 | 7.0% | 4.40 | 4.6% |
| Class and brake backlog, fitted on 2023 to 2025 | 84.0% | 3.86 | 14.1% | 3.63 | 1.9% |
| Class, brake backlog and brake standard hours, out of sample | 87.6% | 4.15 | 7.1% | 4.57 | 5.4% |
| Class, brake backlog and lot size, out of sample | 87.5% | 4.17 | 7.1% | 4.48 | 5.3% |
How the out-of-sample quotes were reached
| Quote | Cell the quote was read from | Quotes at the floor |
|---|---|---|
| Class median | class: 10,626 (96.6%); class standard (no history): 370 (3.4%) | 0 (0.0%) |
| Class and brake backlog, out of sample | own band: 9,500 (86.4%); nearest band: 1,099 (10.0%); class standard (no history): 370 (3.4%); class (no band with enough jobs): 27 (0.2%) | 0 (0.0%) |
| Class, brake backlog and brake standard hours, out of sample | own cell: 9,051 (82.3%); backlog band only: 1,575 (14.3%); class standard (no history): 370 (3.4%) | 0 (0.0%) |
| Class, brake backlog and lot size, out of sample | own cell: 9,052 (82.3%); backlog band only: 1,574 (14.3%); class standard (no history): 370 (3.4%) | 0 (0.0%) |
Out of sample, each job is quoted the median lead time of non-rush jobs shipped before the first day of its release month, in its cell, rounded to whole days and never below the 10th percentile of lead time for the routing class. A cell with fewer than 30 earlier jobs takes the nearest brake backlog band that has them, the deeper band first. Job size is in thirds within the routing class.
Table 18. The recommended quote at the median and at the 80th percentile: jobs shipped within the quote and error
| Quote | Period | Jobs shipped within the quote | Mean error | Mean absolute error | Within 2 days | Mean quote |
|---|---|---|---|---|---|---|
| Current quote | 2023 to 2025 | 71.7% | -1.51 | 4.78 | 27.8% | 12.64 |
| Current quote | Loaded months | 21.9% | +5.84 | 7.34 | 19.5% | 13.95 |
| Current quote | Ordinary months | 78.5% | -2.51 | 4.44 | 29.0% | 12.46 |
| Class and brake backlog, out of sample | 2023 to 2025 | 47.4% | +1.86 | 4.02 | 47.7% | 9.26 |
| Class and brake backlog, out of sample | Loaded months | 33.1% | +5.48 | 8.94 | 17.8% | 14.31 |
| Class and brake backlog, out of sample | Ordinary months | 49.4% | +1.37 | 3.35 | 51.8% | 8.57 |
| Class and brake backlog at the 80th percentile, out of sample | 2023 to 2025 | 73.5% | -1.75 | 4.77 | 29.1% | 12.87 |
| Class and brake backlog at the 80th percentile, out of sample | Loaded months | 46.4% | +1.54 | 9.15 | 12.9% | 18.24 |
| Class and brake backlog at the 80th percentile, out of sample | Ordinary months | 77.2% | -2.20 | 4.18 | 31.3% | 12.14 |
| Class and brake backlog, fitted on 2023 to 2025 | 2023 to 2025 | 52.5% | +1.23 | 3.48 | 49.6% | 9.90 |
| Class and brake backlog, fitted on 2023 to 2025 | Loaded months | 44.9% | +2.18 | 5.57 | 33.1% | 17.60 |
| Class and brake backlog, fitted on 2023 to 2025 | Ordinary months | 53.5% | +1.09 | 3.19 | 51.9% | 8.85 |
| Class and brake backlog at the 80th percentile, fitted on 2023 to 2025 | 2023 to 2025 | 82.2% | -3.35 | 4.92 | 24.7% | 14.48 |
| Class and brake backlog at the 80th percentile, fitted on 2023 to 2025 | Loaded months | 77.1% | -3.56 | 6.38 | 22.5% | 23.34 |
| Class and brake backlog at the 80th percentile, fitted on 2023 to 2025 | Ordinary months | 82.9% | -3.32 | 4.72 | 25.0% | 13.27 |
Table 19. The quote grid with brake standard hours in thirds, fitted on 2023 to 2025: median lead time (jobs in the cell)
| Routing class | Brake standard hours on the job | Under 1 days | 1 to 2 days | 2 to 3 days | 3 to 5 days | Over 5 days |
|---|---|---|---|---|---|---|
| Repeat part | under 1.17 | 7 (1,654) | 8 (677) | 11 (201) | 16 (94) | 18 (186) |
| Repeat part | 1.17 to 2.26 | 7 (1,716) | 8 (648) | 11 (215) | 15 (87) | 18 (146) |
| Repeat part | over 2.26 | 7 (1,738) | 9 (613) | 11 (214) | 17 (87) | 18 (161) |
| New part | under 1.10 | 8 (202) | 9 (97) | (29) | (6) | (18) |
| New part | 1.10 to 2.25 | 8 (231) | 9 (79) | (19) | (14) | (9) |
| New part | over 2.25 | 9 (217) | 11 (83) | (18) | (15) | (20) |
| Outside processing | under 1.13 | 13 (459) | 14 (187) | 19 (67) | (20) | 26 (46) |
| Outside processing | 1.13 to 2.21 | 13 (485) | 14 (173) | 22 (48) | (27) | 28 (45) |
| Outside processing | over 2.21 | 14 (478) | 15 (186) | 18 (47) | (28) | 25 (40) |