1. Condition Monitoring Overview
The shop runs 40 CNC machines and four compressors that supply the plant's air. Its eight HMCs are the bottleneck: they carry 28.7% of the shop's cutting hours at 71% utilization, against 39% to 50% for the other machine classes, and an hour of HMC downtime costs $185 in contribution margin, 1.67x the average for the rest of the fleet.
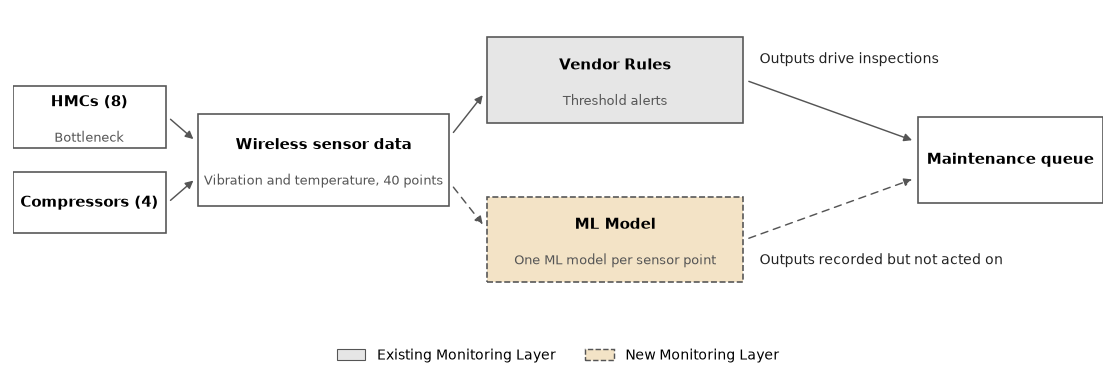
In July 2023 the shop began a pilot of sensor-based condition monitoring on the HMC cell and the compressors: wireless sensors on 40 points, monitored as 28 assets (each HMC's spindle, through-spindle coolant (TSC) pump and flood coolant pump, and each compressor).
Through the pilot, the sensor data has been monitored by the Vendor Rules layer, the sensor vendor's threshold alerts based on limits over baseline. These alerts led to 200 machine inspections from July 2023 to June 2025, and 80% of those inspections found nothing wrong. To improve these results, the pilot's second phase adds the ML Model layer, replacing Vendor Rules' relatively simple thresholds with an anomaly detection machine learning model. Over the evaluation year (July 2025 to June 2026), the ML Model ran in shadow mode beside Vendor Rules, with its ALERTs and ALARMs recorded and not acted on, in order to evaluate its performance.
This report evaluates the performance of the ML Model against Vendor Rules over the evaluation year.
Conditions in the Evaluation Year
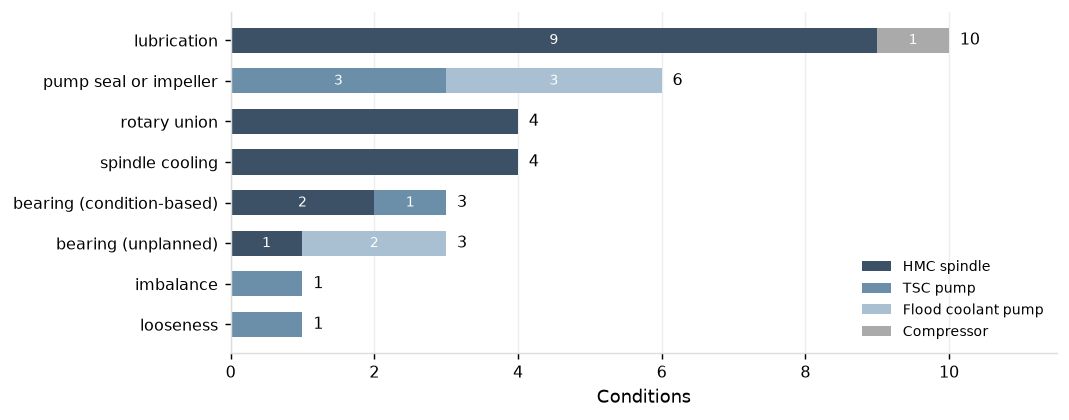
Across the eight HMCs and four compressors, 44 conditions were confirmed from July 2025 to June 2026. 32 were on the sensor points and showed in the sensor data; the comparison in section 2 is on those. Of the other 12, one was on an HMC axis which has no sensor, four showed only in the machine's controller data (two compressor oil cooler faults and two rotary union leaks without coolant ingress), and seven had no precursor signature in any data (sudden trips, crashes and stoppages).
2. Model Results
The ML Model was trained on the first two years of sensor data and has been live in production since July 2025. The results below are presented for the entire evaluation year (July 2025 through June 2026).
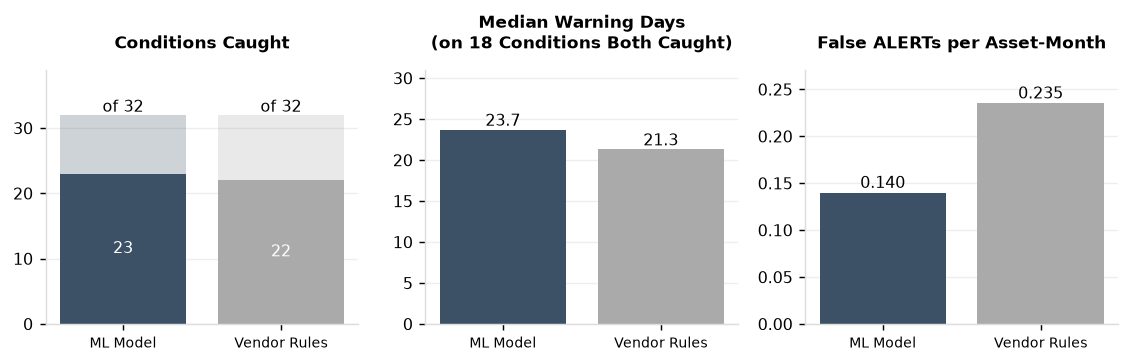
The ML Model achieved notable improvements over Vendor Rules. It caught 23 of 32 conditions compared to 22 of 32; its ALERTs gave an 11% longer warning time and produced a 41% lower false-alert rate. Had the shop acted on the ML Model's ALERTs instead of Vendor Rules', it would have spent 25 fewer hours on inspections of false alerts over the year.
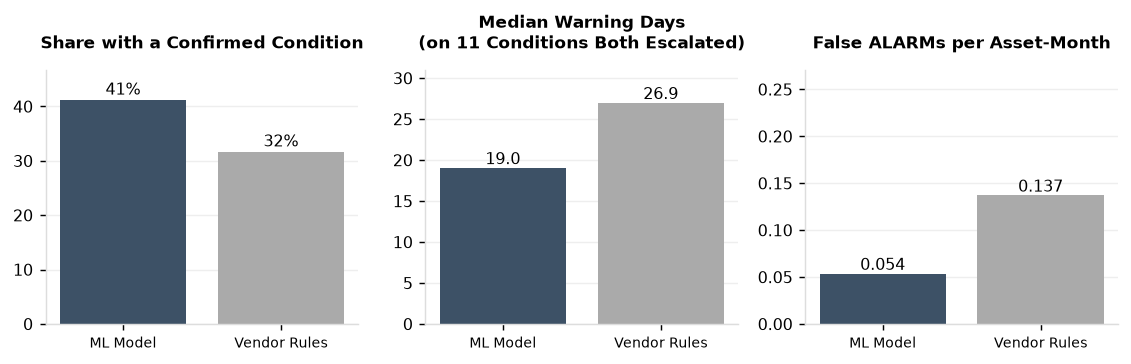
The ML Model's ALARMs were generally more accurate than Vendor Rules', with a 9 percentage point higher share of ALARMs with a confirmed condition and a 61% lower false ALARM rate, but this came at the cost of less warning time.
Detection at ALERT
ALERT is the level at which each method calls for an inspection, so this is the detection comparison. Over the evaluation year, only Vendor Rules' ALERTs triggered inspections in the maintenance queue. The ML Model ran in the background, where its results were recorded and not acted on, so its effectiveness could be measured against Vendor Rules.
| ML Model | Vendor Rules |
|---|---|
| Anomaly score above the point's threshold, the 99.5th percentile of its scores on healthy training hours, for 6 consecutive hours; or above 5 times the threshold for 2 hours, except on pumps during a controller low-pressure alarm | Velocity above the point's baseline plus 25% of the ISO 20816 zone B width, or high-frequency acceleration above its baseline plus 25% of its reference width; a bearing fault band 6 dB above its baseline for 3 hours; velocity in ISO zone C; or housing temperature at the asset class's warning limit. Baselines are set over 21 days after installation and after each repair. |
A condition counts as caught when an ALERT was open on the asset in the 30 days before confirmation. An ALERT that opened more than seven days before the condition began, with no sign of degradation on the asset, is deemed coincidental and not counted.
Of the 32 conditions, the ML Model's ALERTs caught 23 and Vendor Rules caught 22. 18 conditions were caught by both models.
- The ML Model caught five conditions Vendor Rules missed: two spindle cooling faults, a lubrication episode, a bearing failure and a rotary union leak. On these, Vendor Rules either had no alert (2) or produced unrelated ALERTs that missed the condition (3).
- Vendor Rules caught four conditions the ML Model missed: two with under half a day's warning (a spindle cooling fault and a compressor lubrication episode), a pump wear cycle the ML Model had learned as normal in training, and a rotary union leak that fell inside a long ML Model alert on the same spindle.
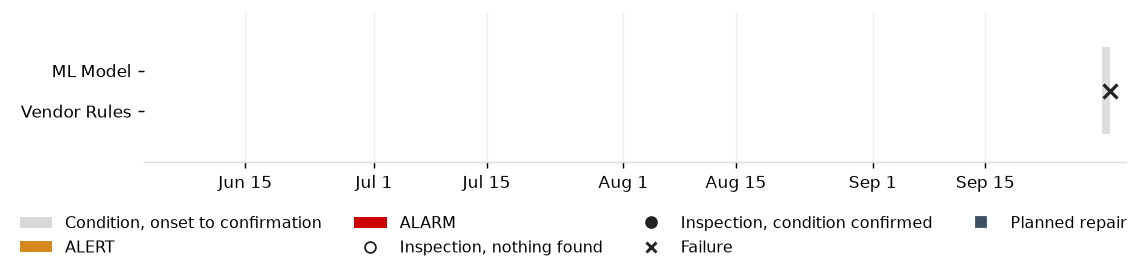
The chart below shows four representative conditions across different outcomes: a condition only the ML Model caught, one only Vendor Rules caught, one that both caught, and one that neither caught. The full chart across all monitored assets is found in the appendix.



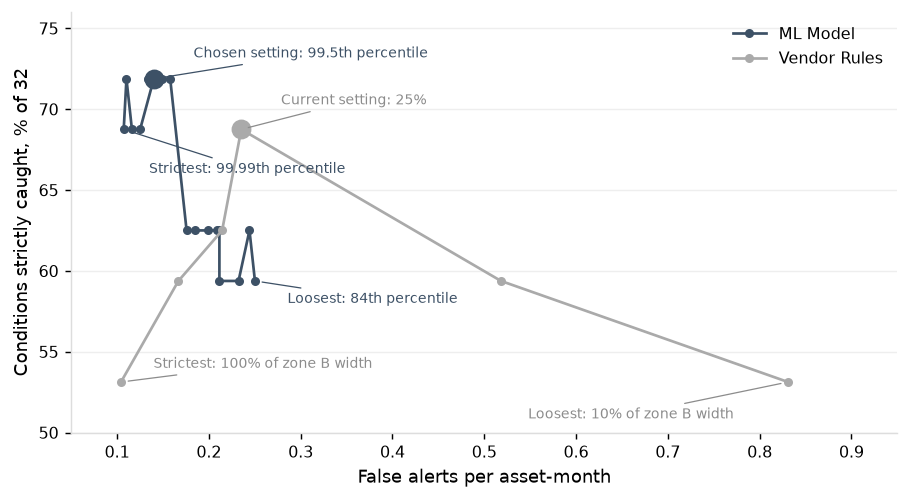
The ML Model produces 0.140 false ALERTs per asset-month against Vendor Rules' 0.235. Vendor Rules raised 79 false alerts, which took 63 inspection hours. The ML Model raised 47, which would have taken about 37 hours at the same labor rate. At their peak month, Vendor Rules' inspections took 2.5% of the three technicians' available hours, against 1.1% if the ML Model's ALERTs were used to drive inspections.
The operating curve below shows conditions caught against false alerts per asset-month for ML Model and Vendor Rules at different alert threshold levels. The ML Model's curve lies to the left of Vendor Rules' current setting from the 88th percentile up: at those thresholds it raised fewer false alerts than Vendor Rules does today, while catching 19 to 23 conditions.
Escalation to ALARM
ALARM is each method's urgent level, so this tests whether an escalation pointed at a real problem.
| ML Model | Vendor Rules |
|---|---|
| An open ALERT plus a severity criterion for the asset class: velocity in ISO 20816 zone D; a stage 3 or 4 bearing signature; the housing temperature residual above its set level; the spindle thermistor at 44 °C or above for 10 minutes, or compressor discharge temperature at 100 °C or above, from the controller; or sustained cavitation on a TSC pump | Velocity above the point's baseline plus 50% of the ISO 20816 zone B width, or high-frequency acceleration above its baseline plus 50% of its reference width; velocity in ISO zone D; or housing temperature at the asset class's alarm limit |
The ML Model's ALARMs were more accurate than Vendor Rules: 41% of its 34 ALARMs had a confirmed condition, against 32% of Vendor Rules' 79 ALARMs, and it produced a 61% lower false-alarm rate (0.054 against 0.137). On the sensor data alone, which both models read, the ML Model's false-alarm rate was even lower, at 0.033. This accuracy came at the expense of warning time: the ML Model's ALARMs gave a median of 19.0 days of warning against Vendor Rules' 26.9 days on the 11 conditions that both layers escalated.
Vendor Rules ALARMed before five of the seven unplanned failures, and the failures still happened: the inspections it triggered found no fault in one, found the problem without preventing the failure in one, and no inspection was raised in the other three.
Condition Diagnosis
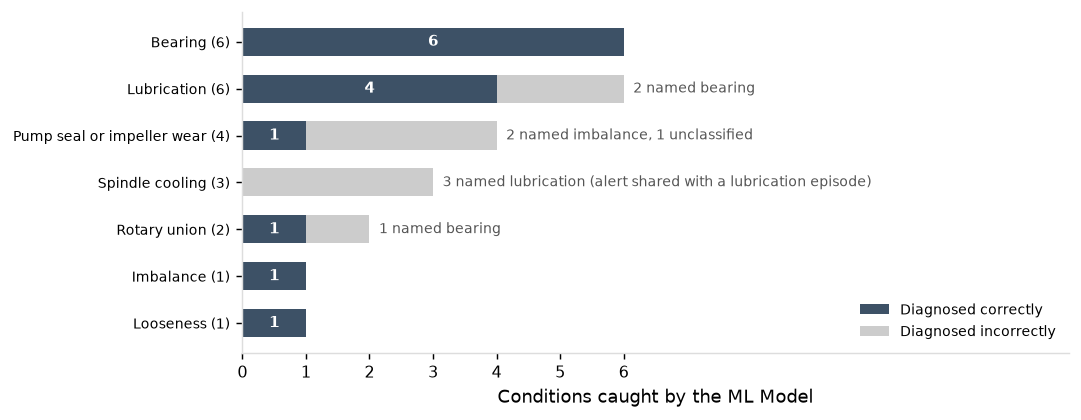
Work requests on the ML Model's ALERTs and ALARMs correctly diagnosed the confirmed condition on 14 of the 23 conditions it caught.
The ML Model's work requests were strongest on conditions with a distinct signature, naming all six bearing defects (three with the damaged component located), four of six lubrication episodes and both imbalance and looseness cases. It struggled where conditions overlapped or share a signal: three of four pump-wear cases were misnamed, mostly as imbalance; the three spindle cooling faults were named lubrication, the condition sharing their alert; and one of two rotary union leaks was named bearing despite a 9.2% coolant pressure drop.
3. Model Overview
Sensors
The ML Model and Vendor Rules read from 40 sensor points: four on each of the eight HMCs and two on each of the four compressors. Once an hour, each point records one second of vibration on three axes, sampled 25,600 times a second, and its housing temperature. A measurement is taken only in a steady state (spindles above 3,000 rpm and steady for 10 seconds; pumps and compressors running), so hours are comparable.
| Asset type | Points per unit | Location | Axes | Total points |
|---|---|---|---|---|
| HMC spindle | 2 | Front and rear bearing housings | Triaxial | 16 |
| TSC pump | 1 | Pump motor, drive end | Triaxial | 8 |
| Flood coolant pump | 1 | Pump motor, drive end | Triaxial | 8 |
| Compressor | 2 | Motor drive end; airend inlet | Triaxial | 8 |
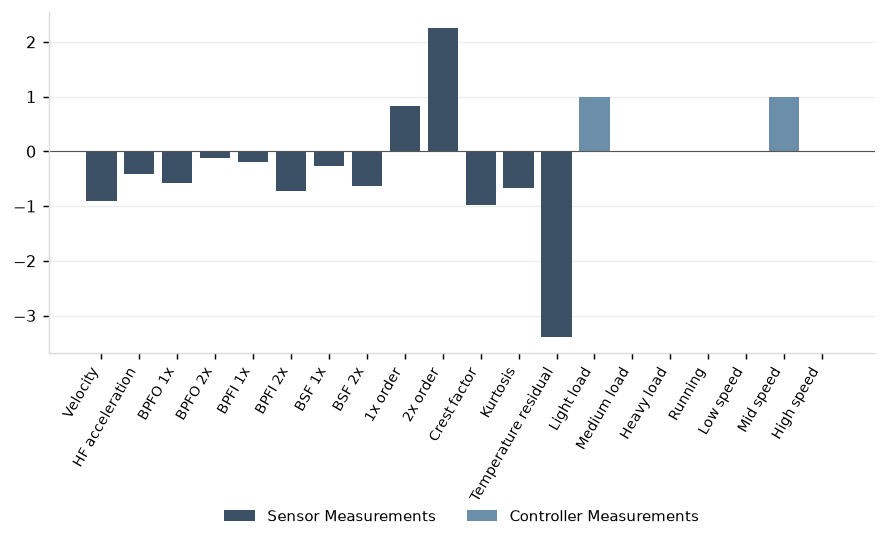
The sensor node computes and reports 13 measurements (used by both layers): vibration velocity, high-frequency acceleration, bearing fault-frequency energies (six: the outer race, inner race and rolling elements, each at 1× and 2× its fault frequency), shaft-order energies (two: 1× and 2× running speed), crest factor, kurtosis and housing temperature. The ML Model also reads seven measurements (so 20 total inputs) of the machine's operating state from its controller, such as the spindle speed band and the cutting load, so it compares each hour with healthy hours under the same conditions.
ML Model at a glance
| What it reads | What it learns | What it produces |
|---|---|---|
| Every hourly measurement on 40 sensor points: velocity, high-frequency acceleration, the bearing fault bands, shaft-order energies, crest factor, kurtosis and the temperature residual, with the operating measurements from the controller | Each point's healthy pattern from up to two years of its own history, across operating regimes, re-centered after each repair and sensor remount | An hourly anomaly score per point, the inputs that moved most, and for those scores beyond threshold, a level per asset (ALERT, ALARM) with a suspected condition |
The ML Model is an autoencoder, a neural network trained separately for each sensor point on that point's healthy hours. Each hour, it compresses the 20 inputs through a narrow bottleneck layer then rebuilds them. Having learned only healthy machine readings, it rebuilds a healthy hour closely. A developing fault moves the measurements in ways the healthy hours never did, so the rebuild falls short. The size of that gap is the model's anomaly score, and the measurements with the largest gaps are reported as the leading inputs.
Model outputs
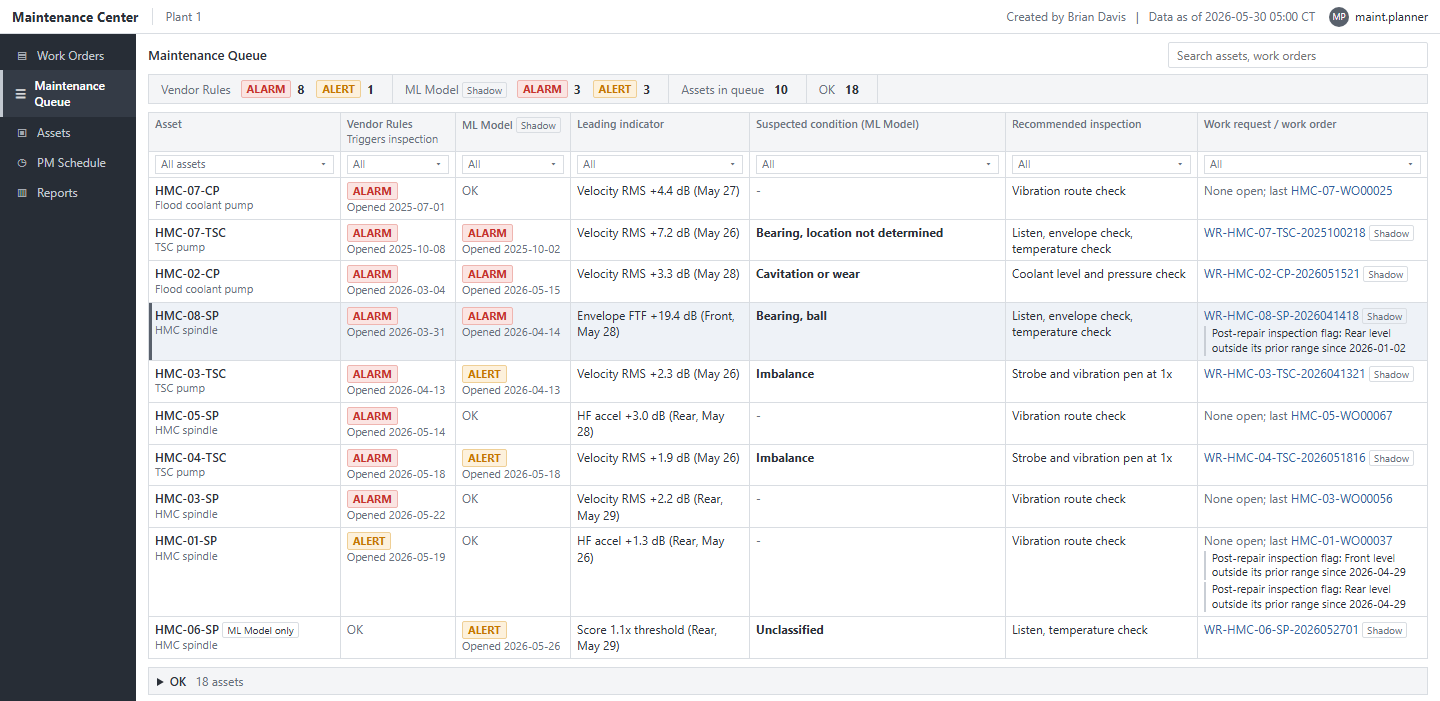
Each hour, the ML Model's anomaly score level for each asset (the highest of its points) appears in the maintenance queue as OK, ALERT, or ALARM, beside Vendor Rules' level. An ALERT opens a work request naming the suspected condition and a recommended inspection. During the evaluation year these ALERTs and ALARMs were recorded and not acted on.
3.1 Training Data
From signal to inputs
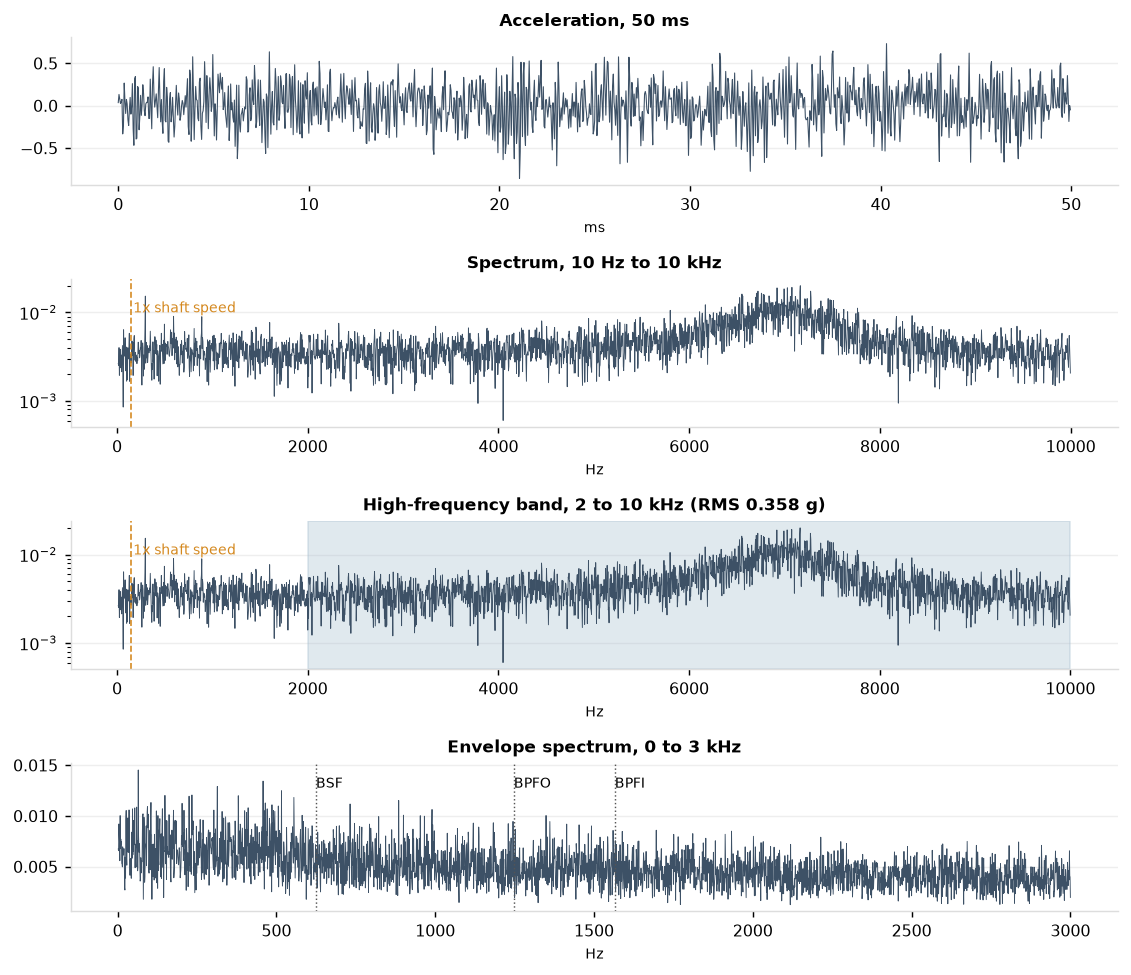
Each hour's measurement starts as one second of acceleration, shown here from a healthy hour on an HMC spindle's front bearing. Its frequency spectrum shows the spindle's rotation as narrow peaks, which give the velocity and shaft-order measurements. The 2 to 10 kHz band, where bearing impacts first ring the housing, gives high-frequency acceleration, and demodulating it produces the envelope spectrum, checked for peaks at each bearing's defect rates (outer race, BPFO; inner race, BPFI; rolling elements, BSF). On this healthy hour, the envelope spectrum shows no peak at any defect rate.
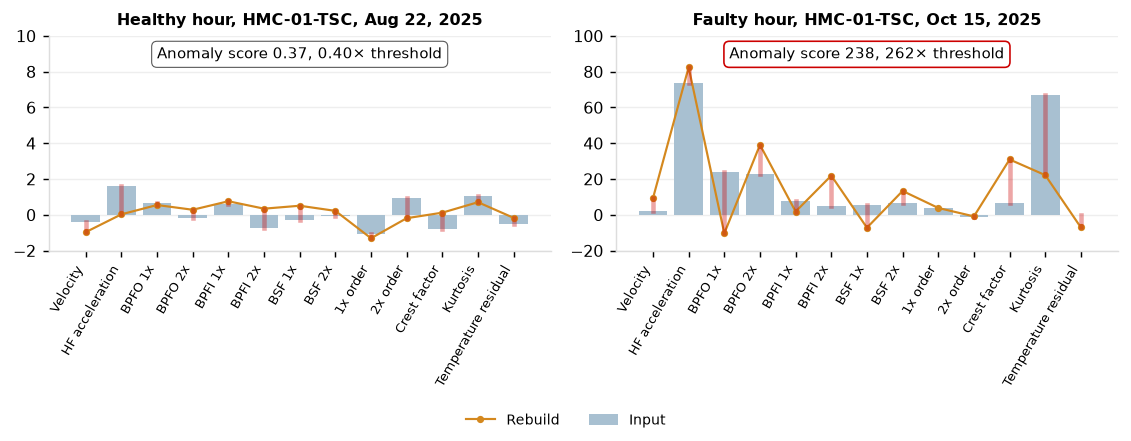
Each of the 13 sensor measurements is calculated from these signals as one number for the hour, which is then compared to the point's normal level, so a healthy hour sits near zero. These measurements join the seven controller measurements which mark the hour's speed and load with an on/off flag (1 and 0; here, the machine was running with a light load at medium speed). Together they are the ML Model's 20 inputs, as shown below, which is calculated from the vibration data on the healthy hour as detailed above.
Healthy hours
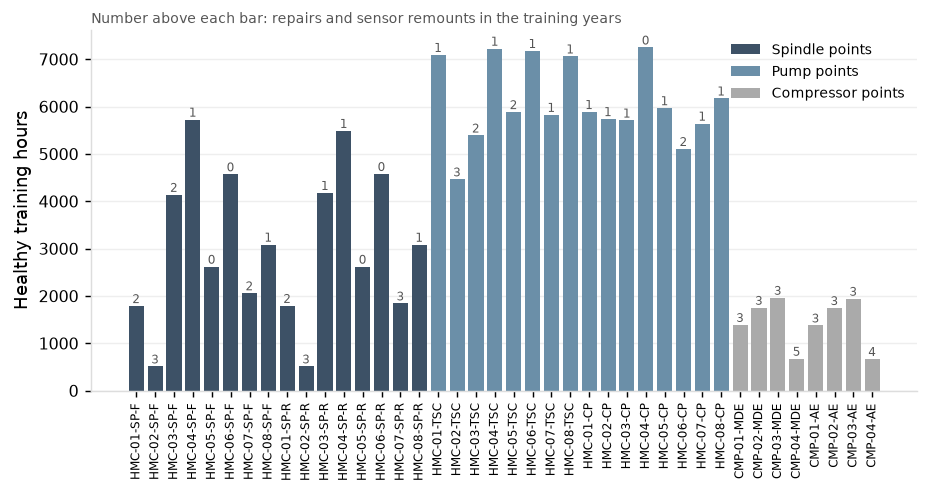
The ML Model is trained on healthy hours which form the basis of its anomaly detection. An hour counts as healthy when the point was measured and no repair was under way, no work order was open, and, after any repair or sensor remount, the point's readings had settled at a new level. The 120 days before any confirmed condition are excluded, so that a fault developing before it was found does not enter training as a healthy hour.
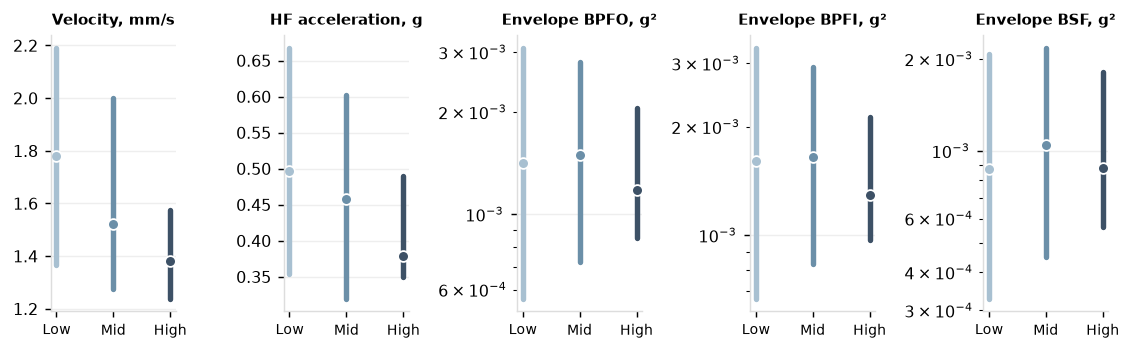
On a healthy hour, vibration velocity sits in ISO 20816 zone A or B (1.2 to 2.3 mm/s on spindles, rising with load), kurtosis is near 3, crest factor is 4.1 to 5.0, and the envelope spectrum has no peak at a fault frequency. Healthy levels shift with spindle speed and rise with load, and the controller measurements let the model learn each point's healthy pattern across them.
The ML Model was trained on 157,703 healthy hours from July 2023 to June 2025 (512 to 7,249 per point). The chart below shows the number of healthy training hours for each sensor point. The number above each bar counts the point's repairs and sensor remounts in the training years. Each one removes hours from training, mostly the 120 days before the condition that led to it, so points with higher repairs and remounts had lower healthy training hours.
3.2 Scoring Summary
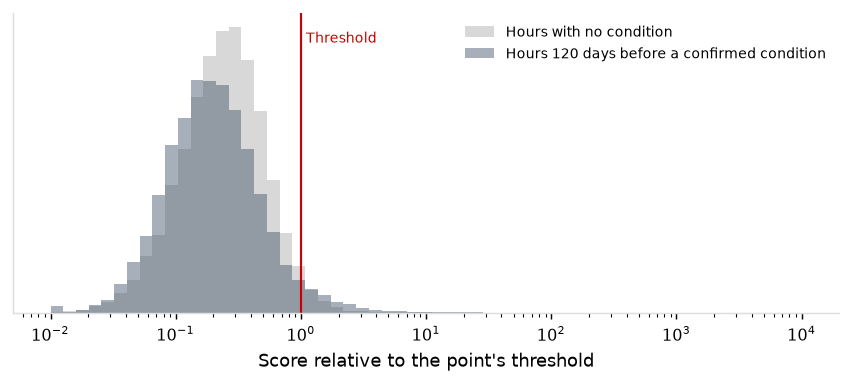
The ML model's ALERT threshold is the 99.5th percentile of each point's healthy training scores. Six consecutive hours above it raise ALERT, or two hours above five times it, except on a pump during a low-pressure alarm. ALARM follows on an open ALERT when a severity criterion for the asset class holds (section 2). If a point stays above its threshold for 30 days with no open work order, no confirmed condition and no significant upward trend, its threshold is reset on those 30 days; five points were reset in this way over the evaluation year.
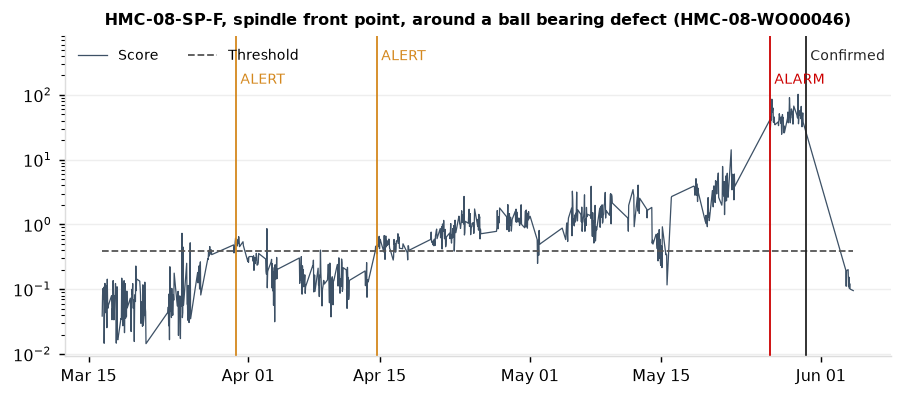
On a healthy hour the model rebuilds every input to within about one unit, so the anomaly score stays low. A faulty hour is shown below, five weeks before HMC-01's TSC pump bearing was confirmed, where kurtosis, outer-race (BPFO) envelope energy and crest factor all peaked and the anomaly score rose to 262x the threshold; those inputs led the work request to name an outer-race bearing defect.
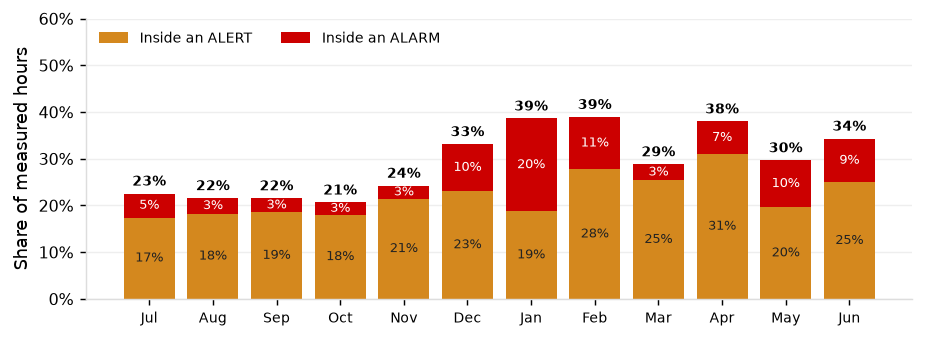
Over the evaluation year the ML Model scored 128,862 measured hours on 40 points. 71% were outside any episode, 22% inside an ALERT and 7% inside an ALARM, 178 alert-hours per asset-month against Vendor Rules' 276. It opened 81 ALERT episodes across 25 assets and escalated 34 to ALARM.
31% of the ML Model's ALERT hours led with shaft-order energies (imbalance, looseness, pump wear), 25% with the temperature residual, 28% with the fault bands, crest factor or kurtosis, 10% with velocity or high-frequency acceleration, and 6% with the controller measurements.
| Asset class | Measured hours | ALERT episodes | ALARMs | Median episode length, days | Leading input group |
|---|---|---|---|---|---|
| Compressor | 12,765 | 5 | 4 | 9.5 | fault bands, crest factor or kurtosis |
| Flood coolant pump | 29,037 | 14 | 8 | 11.5 | fault bands, crest factor or kurtosis |
| HMC spindle | 58,028 | 46 | 11 | 11.3 | temperature residual |
| TSC pump | 29,032 | 16 | 11 | 20.3 | shaft-order energies |
3.3 Condition Signatures
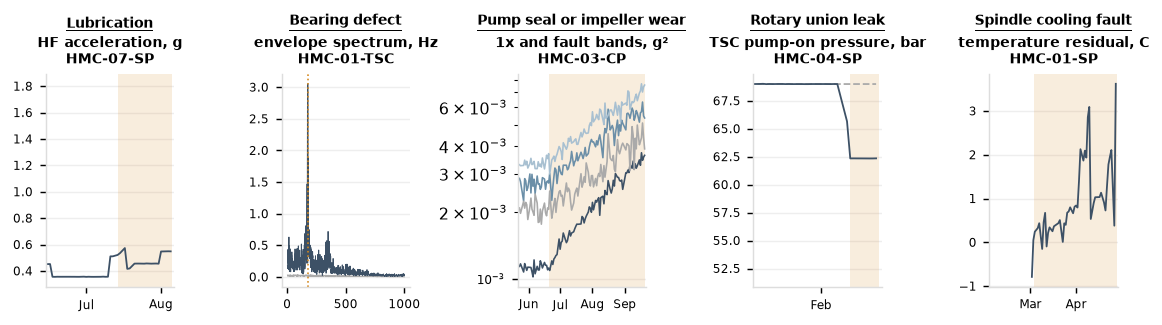
The five most common conditions of the evaluation year each carry their own vibration and temperature signature.
- Lubrication (10): high-frequency energy rises 9 to 56% over days and temperature rises 1 to 5 °C, with no fault-frequency peaks.
- Bearing defect (6): envelope peaks at the fault frequency and its harmonics, then rising kurtosis; velocity rises only late.
- Pump seal or impeller wear (6): energy at 1× running speed and broadband energy rise together.
- Rotary union leak with coolant ingress (4): through-spindle coolant pressure falls 9 to 10.5% below its reference; the spindle points show little change.
- Spindle cooling fault (4): the temperature residual climbs.
4. Model Evaluation
4.1 Model Selection
Four model types (PCA, Mahalanobis distance, isolation forest and an autoencoder) were trained per sensor point on five input sets (20 models trained), from the 13 sensor measurements to a full set of 52 inputs with the entire spectrum and envelope bands. Each model was trained with one threshold per point or one per spindle speed band. Each model was then scored and selected by a fixed rule: take the highest catch rate above chance (the share an alert would catch if it fell at random, given how much of the time it was open) at Vendor Rules' false-alert rate; and, among those within two caught conditions of the best, choose the simplest model.
The autoencoder with the 13 measurements was selected (skill of 0.356); the wider input sets did not improve it. A full detail of what each design choice added in the training round is in the appendix.
| Model | Inputs | Threshold | Catch at budget | Chance | Skill above chance | Caught at operating point | False episodes per asset-month | Selected |
|---|---|---|---|---|---|---|---|---|
| Autoencoder [16-6-16], 200 epochs (retuned to 16-4-16) | vendor (13) | One per point | 0.77 | 0.42 | 0.356 | 19.8 | 0.192 | ✔ |
| Autoencoder [16-6-16], 400 epochs | extended (37) | By speed band | 0.85 | 0.46 | 0.347 | 21.2 | 0.234 | |
| Autoencoder [16-6-16], 200 epochs | full spectrum and envelope (52) | One per point | 0.77 | 0.42 | 0.274 | 19.4 | 0.241 | |
| Mahalanobis distance | extended (37) | One per point | 0.73 | 0.47 | 0.257 | 20.0 | 0.250 |
4.2 Accuracy and Validation
The evaluation year scores the ML Model and compares it to Vendor Rules' performance.
On the evaluation year, the ML Model caught 72% of conditions with 19.2 days of warning on its catches at 0.140 false episodes per asset-month, against 79% with 11.8 days of warning on its catches at 0.170 false episodes per asset-month on the training folds. It caught fewer conditions in evaluation than training, mostly on lubrication episodes, discussed in 4.3.
The ML Model raised fewer false alerts than Vendor Rules in every period, on both training folds and in all four quarters of the evaluation year. It caught a higher share of conditions on both folds and in Q2 and Q3, and a lower share in Q1 (44% against 78%, the quarter the monitoring report flags) and Q4 (67% against 83%).
| Method | Measure | Fold 1 | Fold 2 | Evaluation year | Q1 | Q2 | Q3 | Q4 |
|---|---|---|---|---|---|---|---|---|
| ML Model | Catch rate | 79% | 80% | 72% | 44% | 75% | 100% | 67% |
| ML Model | False alerts per asset-month | 0.189 | 0.150 | 0.140 | 0.118 | 0.106 | 0.157 | 0.179 |
| ML Model | Conditions | 14 | 10 | 32 | 9 | 8 | 9 | 6 |
| Vendor Rules | Catch rate | 71% | 60% | 69% | 78% | 62% | 78% | 83% |
| Vendor Rules | False alerts per asset-month | 0.224 | 0.246 | 0.235 | 0.201 | 0.307 | 0.242 | 0.287 |
| Vendor Rules | Conditions | 14 | 10 | 32 | 9 | 8 | 9 | 6 |
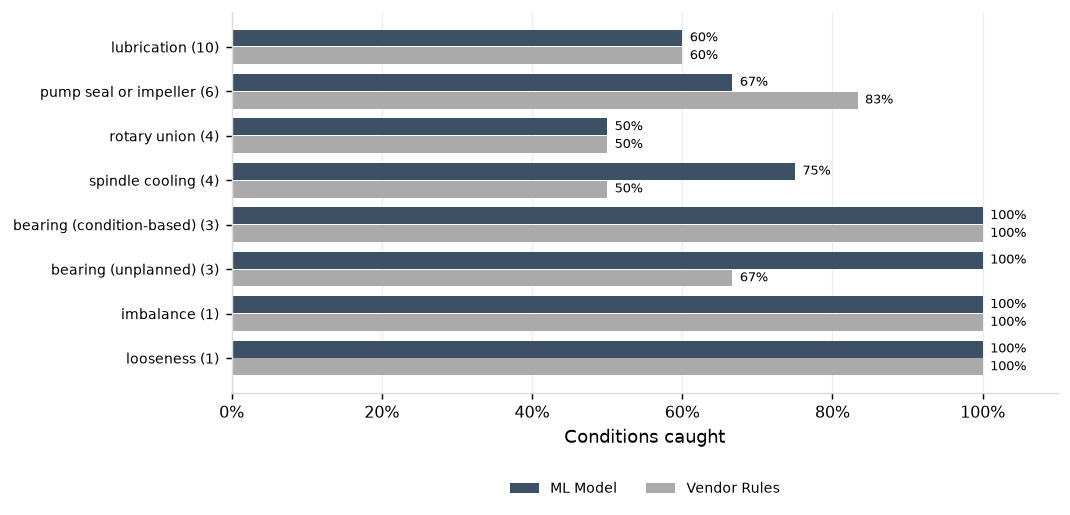
Over the evaluation year, the ML Model matched or beat Vendor Rules on every condition type except pump seal or impeller wear (four of six against five of six), and caught all six bearing defects, one unplanned bearing defect and one spindle cooling fault more than Vendor Rules. Lubrication, the most common condition, was caught at 60% by both methods.
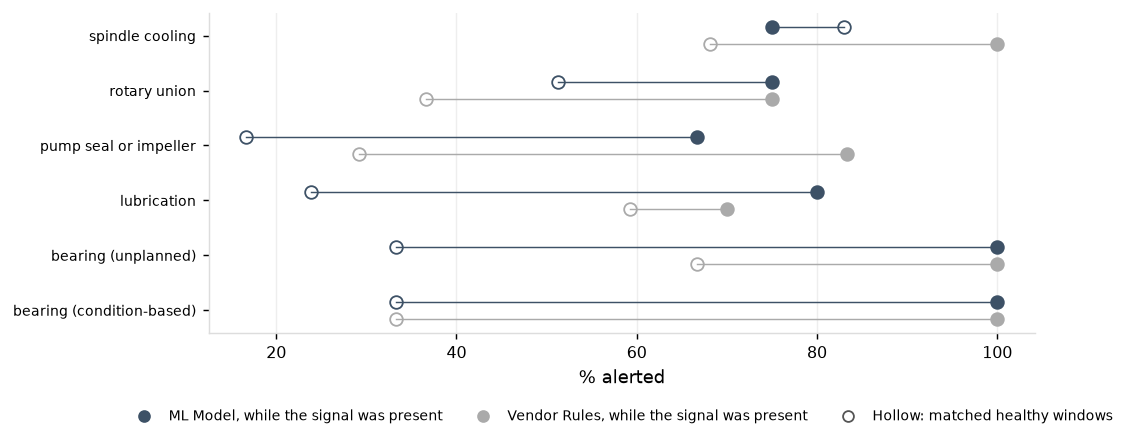
A method can be credited with a catch simply because its alerts are open much of the time, so each condition type was checked against how often the same method alerted when nothing was wrong. In the chart below, the filled marker shows how often a method had an alert open while the condition was developing, and the hollow marker how often it had one open over matched healthy windows: stretches of the same length on the same asset with no condition present. The ML Model's alerts tracked bearing defects, lubrication and pump wear far above its healthy-window rate, while Vendor Rules' lubrication alerts barely exceeded theirs (70% against 59%); on spindle cooling, the ML Model did no better than its healthy-window rate (75% against 83%).
4.3 False Alerts & Misses
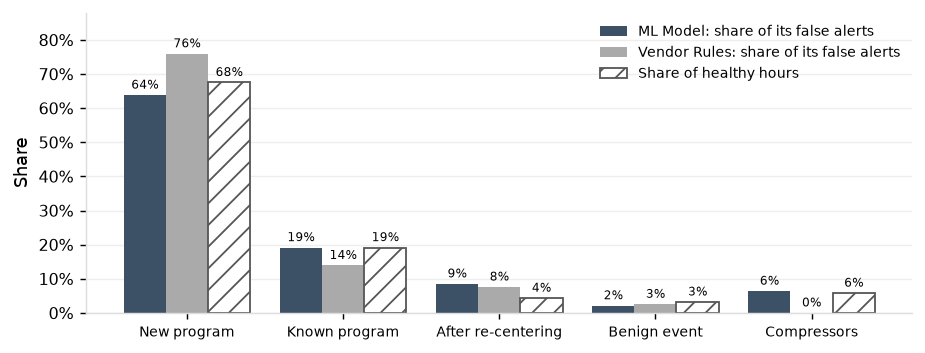
Measured against the share of healthy hours in each context, the ML Model's false alerts fell less often on new programs than Vendor Rules' (64% of its false alerts against 76%, with new programs making up 68% of healthy hours), where unfamiliar cutting loads push vibration past Vendor Rules' fixed limits. A higher share of the ML Model's false alerts fell on known programs (19% against 14%), in line with their 19% of healthy hours, and on the compressors (6%, where Vendor Rules raised none), also in line with their hours. Both methods' raised false alerts at elevated rates in the two weeks after a repair re-centered a point, at about twice that period's 4% share of healthy hours.
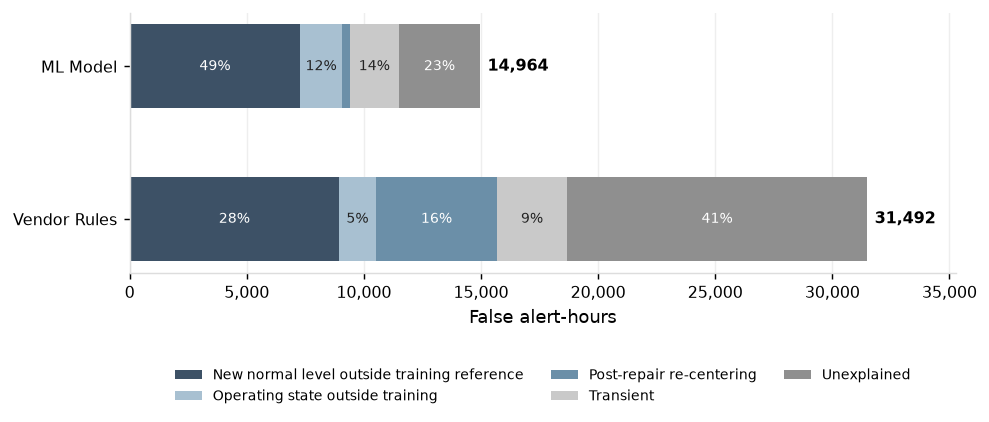
The ML Model raised half the false-alert hours as Vendor Rules (14,964 vs. 31,492). 49% of the ML Model's false alert-hours came from sensor points whose healthy level moved outside the range it was trained on. 17 of its 47 false alerts, across seven sensor points, opened this way. Of the rest, 12 were short crossings above threshold and 12 had no identifiable cause.
The ML Model missed nine of the 32 conditions:
- Five fell under an ALERT that had opened more than a week before the condition showed any sign on the machine, so the ALERT could not have been prompted by it and they are not counted.
- Three had a score that crossed the threshold without staying above it: a lubrication episode, a wear cycle on HMC-06's flood pump that the model had learned as healthy in training, and a wear cycle on HMC-06's TSC pump.
- One came while the point was re-centering after a repair, with no level to score against: a compressor lubrication episode.
| Asset | Condition | Confirmed | Reason |
|---|---|---|---|
| HMC-01-SP | lubrication | 2025-08-14 | Score crossed the threshold without staying above it |
| HMC-06-SP | spindle cooling | 2025-09-12 | ALERT opened more than a week before the condition with no sign of it |
| HMC-06-CP | pump seal or impeller | 2025-09-20 | Score crossed the threshold without staying above it |
| CMP-02 | lubrication | 2025-09-29 | Point re-centering after a repair |
| HMC-06-TSC | pump seal or impeller | 2025-09-30 | Score crossed the threshold without staying above it |
| HMC-08-SP | rotary union | 2025-10-01 | ALERT opened more than a week before the condition with no sign of it |
| HMC-02-SP | lubrication | 2025-12-24 | Inside an ALERT opened more than 120 days earlier |
| HMC-02-SP | rotary union | 2026-05-10 | Inside an ALERT opened more than 120 days earlier |
| HMC-01-SP | lubrication | 2026-05-11 | ALERT opened more than a week before the condition with no sign of it |
4.4 Limitations
- Small counts. 32 conditions and seven failures; a difference of two or three conditions could reverse in another year.
- Points stuck in ALERT. The HMC-02 spindle points' temperature residual ran outside its training range after 512 training hours and held both points in ALERT for most of the year, hiding two conditions. A clamp on the residual fixed HMC-02 but raised stuck points elsewhere on the folds and was set aside.
- Conditions the sensors cannot see. 19 of the year's 51 conditions are outside this comparison: eight on machines without sensors, and 11 that left no trace in the sensor data (trips, crashes, stoppages, compressor oil cooler faults and leaks visible only in controller pressure).
- Diagnosis limits. One alert names one condition, so a condition sharing an alert with another on the same asset is named only if it leads. On pumps, a rise at running speed alone cannot separate impeller wear from imbalance. Rotary-union leaks dropped through-spindle coolant pressure 9 to 10.5%; the drop names a leak only when no earlier rule fires, so one of the two caught was named bearing.
- Resets during degradation. Three of the five threshold resets in the year came while the point was degrading. None cost a catch, but each raised a threshold over a developing fault.
- Wear learned as healthy. A wear cycle on HMC-06's flood pump was in the training years' healthy hours, so the model did not alert on its return.
- Label noise. CMMS failure codes are wrong on about 15% of unplanned repairs, and the same noise limits the diagnosis match, which is scored against those codes.
- Chiller faults have no controller fault contact, so abrupt faults show only in temperature.
Appendix
Indicators
| Input | What it measures | Source |
|---|---|---|
| Velocity | Vibration velocity RMS, 10 to 1,000 Hz (mm/s) | Sensor |
| HF acceleration | High-frequency acceleration RMS, 2 to 10 kHz (g) | Sensor |
| BPFO 1x | Envelope energy at the outer-race fault frequency | Sensor |
| BPFO 2x | Envelope energy at twice the outer-race fault frequency | Sensor |
| BPFI 1x | Envelope energy at the inner-race fault frequency | Sensor |
| BPFI 2x | Envelope energy at twice the inner-race fault frequency | Sensor |
| BSF 1x | Envelope energy at the rolling-element fault frequency | Sensor |
| BSF 2x | Envelope energy at twice the rolling-element fault frequency | Sensor |
| 1x order | Spectral energy at 1x running speed | Sensor |
| 2x order | Spectral energy at 2x running speed | Sensor |
| Crest factor | Peak over RMS of the acceleration | Sensor |
| Kurtosis | Impulsiveness of the acceleration | Sensor |
| Temperature residual | Housing temperature less its expected value for the operating state (C) | Sensor |
| Light load | Cutting load regime: light | Controller |
| Medium load | Cutting load regime: medium | Controller |
| Heavy load | Cutting load regime: heavy | Controller |
| Running | Running without a cutting regime (pumps, compressors) | Controller |
| Low speed | Spindle speed band: low | Controller |
| Mid speed | Spindle speed band: mid | Controller |
| High speed | Spindle speed band: high | Controller |
Platform
| Component | Role |
|---|---|
| Azure Data Lake Storage Gen2 | Raw sensor, controller, CMMS and ERP exports |
| Unity Catalog | Catalog, schemas, external location and access control |
| Lakeflow Declarative Pipelines | Bronze, silver and gold tables with expectations |
| Lakeflow Jobs | Training, scoring, levels and work requests, evaluation, monitoring |
| MLflow with the Unity Catalog model registry | The 40 point models as one registered model, alias champion |
| Declarative Automation Bundles deployed through GitHub Actions | Development and production targets |
Model training
| Design choice | Round | Caught | False alerts per asset-month | Stuck points | Result |
|---|---|---|---|---|---|
| 37 inputs instead of the 13 measurements | Selection round | 20.0 | 0.226 | not adopted | |
| 45 inputs instead of the 13 measurements | Selection round | 19.0 | 0.223 | not adopted | |
| 52 inputs instead of the 13 measurements | Selection round | 20.0 | 0.253 | not adopted | |
| 13 inputs (the 13 measurements, kept) | Selection round | 20.0 | 0.200 | kept | |
| One threshold per point (same model) | Tuning round | 19.8 | 0.185 | kept | |
| Thresholds by speed band | Tuning round | 19.8 | 0.186 | not adopted | |
| 3 hours of persistence instead of 6 | Version 13 folds | 18.0 | 0.223 | not adopted | |
| 6 hours of persistence (kept) | Version 13 folds | 19.0 | 0.170 | kept | |
| 12 hours of persistence instead of 6 | Version 13 folds | 17.0 | 0.131 | not adopted | |
| Fix round 1 baseline | Fix round 1 | 19.6 | 0.168 | 6.0 | |
| F1: hold the last accepted level | Fix round 1 | 19.6 | 0.183 | 6.0 | adopted |
| F2: a shorter post-repair window | Fix round 1 | 19.8 | 0.157 | 8.0 | set aside: stuck points 8.0 against 6.0 |
| F3: spindle temperature residual with regime terms | Fix round 1 | 19.8 | 0.161 | 5.6 | adopted |
| F4: fast ALERT at 5 times the threshold | Fix round 1 | 19.6 | 0.170 | 6.0 | adopted (tightened) |
| Final round baseline | Final round | 21.4 | 0.170 | 5.6 | |
| T1: training without Vendor Rules alert hours | Final round | 22.0 | 0.210 | 14.6 | set aside: false alerts 0.210, stuck points 14.6 |
| T2: seasonal temperature term only with 9 months | Final round | 21.8 | 0.186 | 8.6 | set aside: stuck points 8.6 |
| T3: no ALERT under 1,000 training hours | Final round | 14.8 | 0.111 | 5.6 | set aside: caught 14.8 |
| S1: post-repair level window of up to 60 days | Final round | 21.4 | 0.161 | 5.6 | adopted |
| Improvement round baseline | Improvement round | 19.4 | 0.137 | 3.2 | |
| C1: the wear-stretch exclusion | Improvement round | 19.2 | 0.127 | 5.4 | set aside: strict 19.2, stuck points 5.4 |
| C2: the seasonal clamp on the temperature residual | Improvement round | 19.4 | 0.147 | 5.0 | set aside: stuck points 5.0 |
| C3: re-arm of a point flat above its threshold | Improvement round | 19.4 | 0.135 | 3.2 | adopted |
| C4: post-repair window after repairs to other components | Improvement round | 19.4 | 0.132 | 3.2 | adopted |
Full timeline
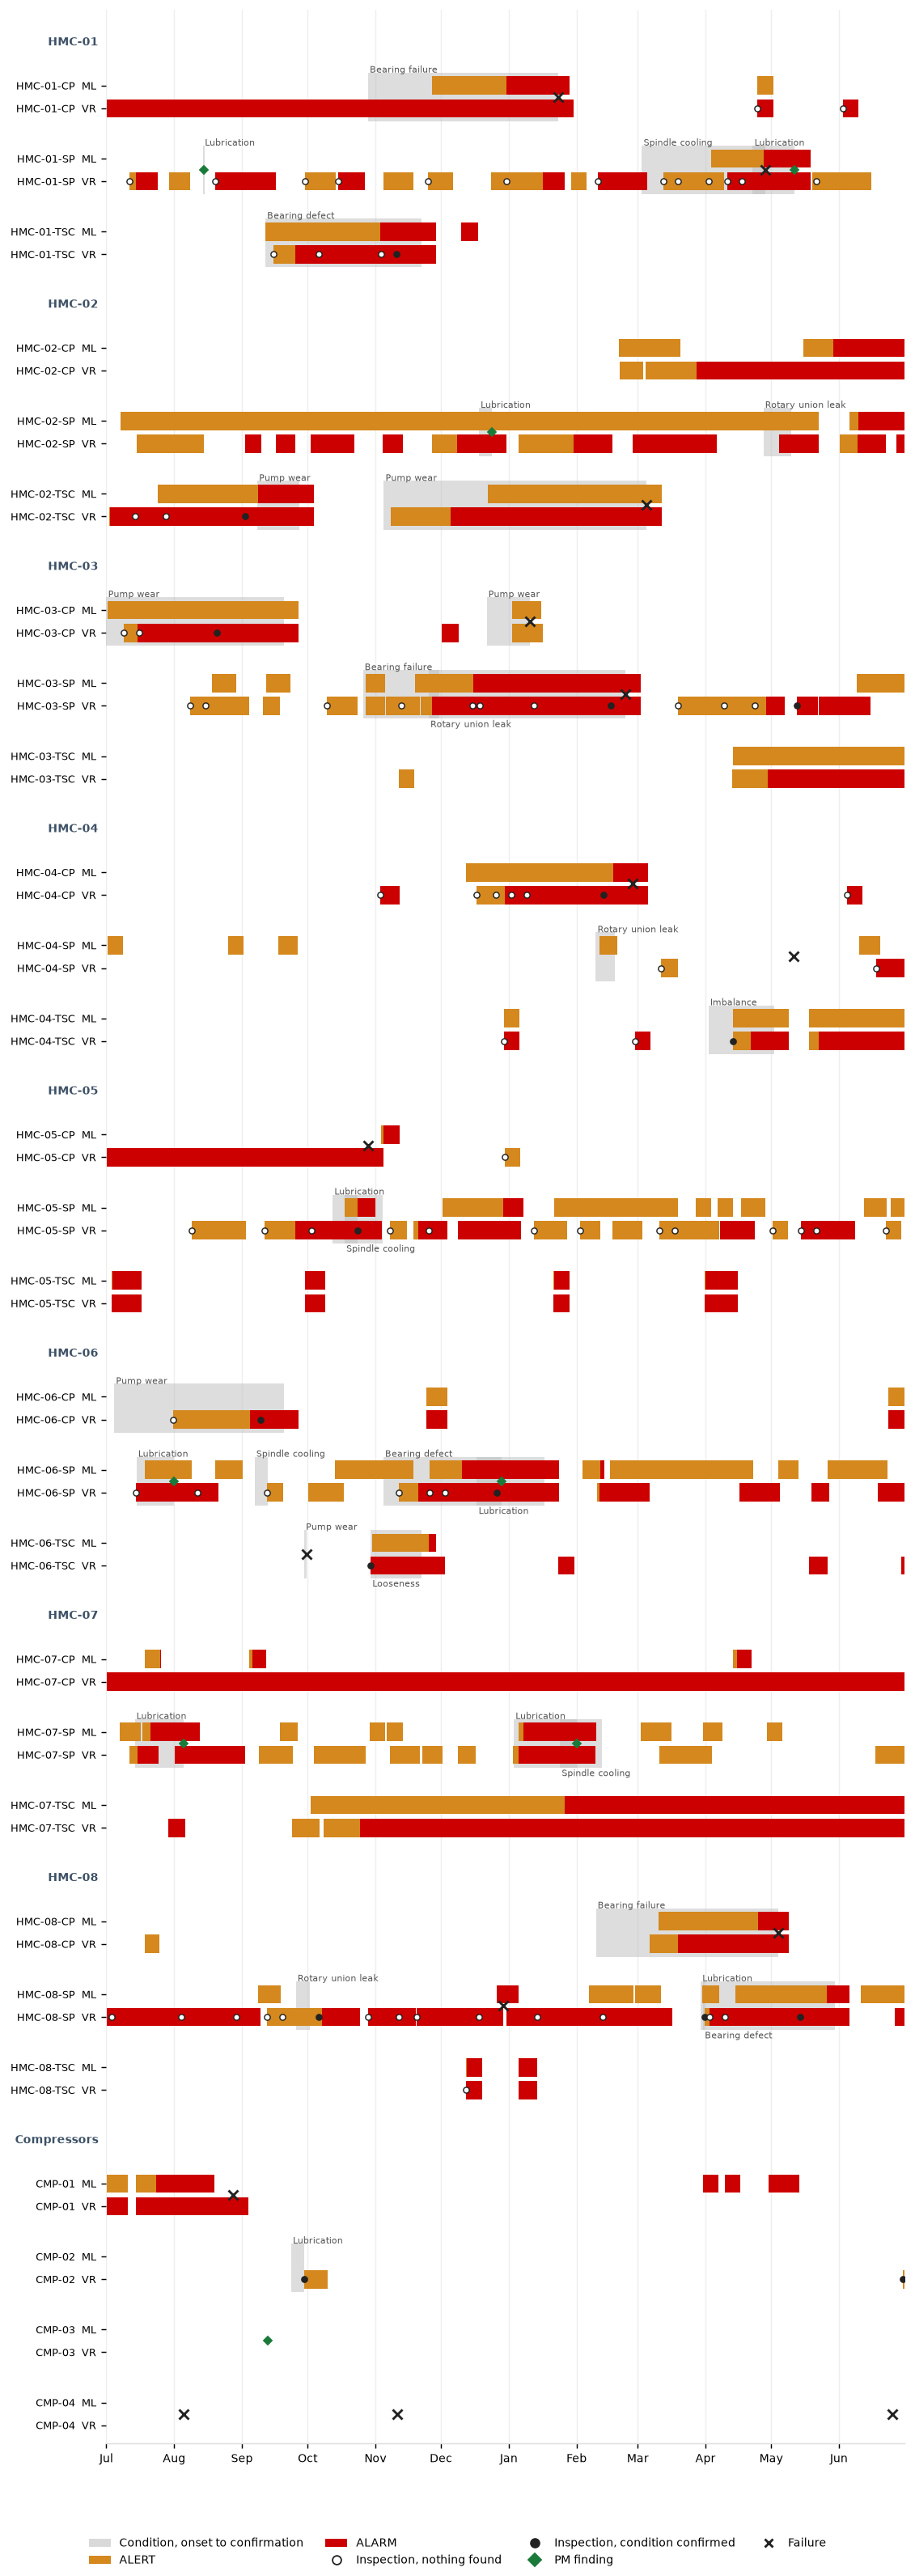
Spindles and compressors carry two sensor points; each lane shows the higher level of the two at each hour.