1. Summary
In Q2 2026, 93 of 100 critical characteristics held above the Ppk threshold of 1.33. Of the seven that were below the Ppk threshold, four had confidence intervals that extended over the threshold, and are flagged for monitoring. Three were flagged as needing to be reported to the customers: two had confidence intervals wholly under the Ppk threshold, and one was under both the Ppk and Cpk threshold.
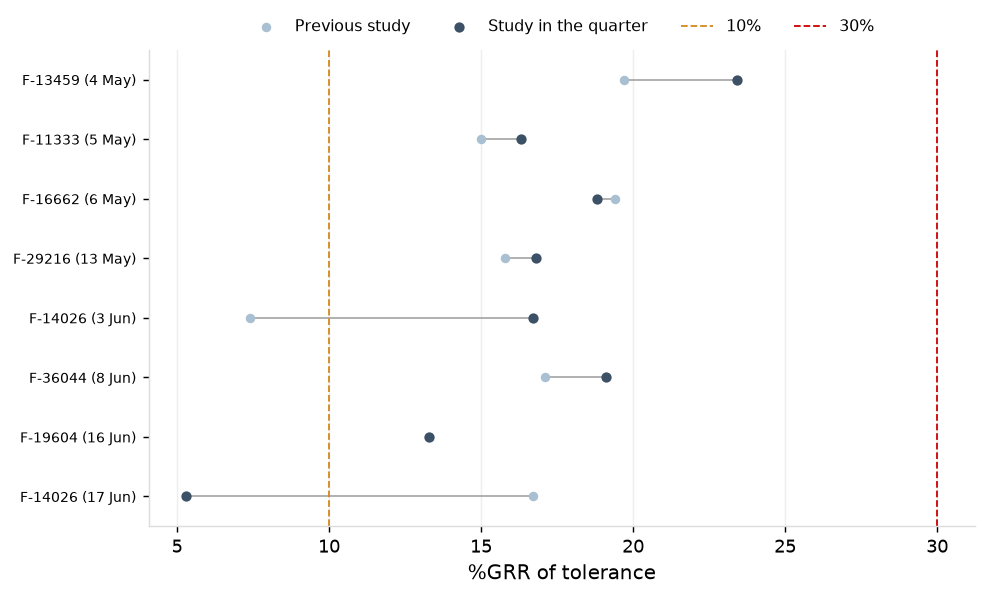
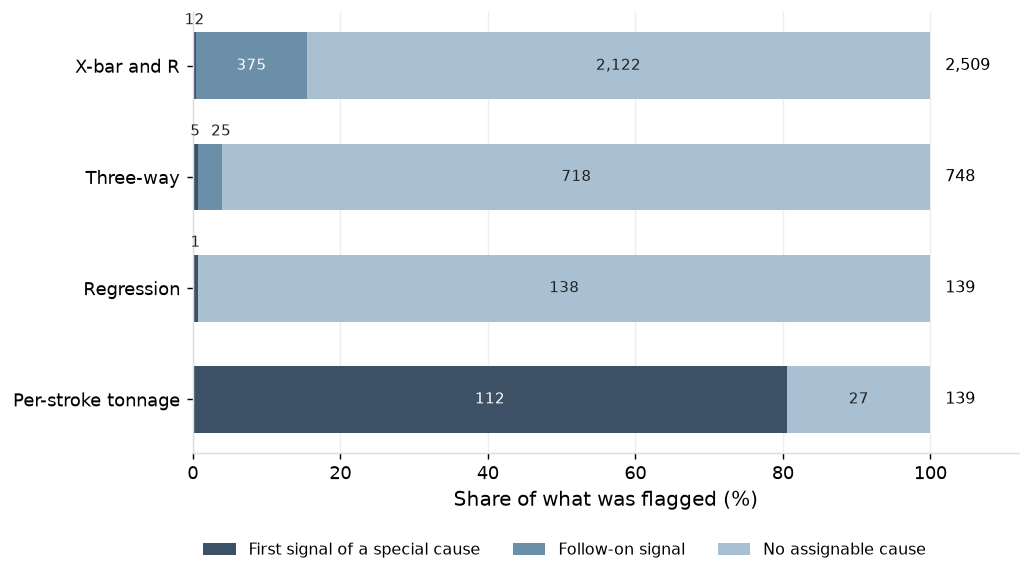
Signals with no assignable cause ran slightly above expectations at 1.23x. 100% of the 18 special causes found on the characteristic chart signals were closed by the end of the quarter. 112 of the 139 (81%) stops on the per-stroke tonnage charts found a special cause. 11% of gauge studies were above the 10% GRR threshold, all flagged for studies. No charts in the quarter set limits from a gauge that was out of service.
2. Capability Review
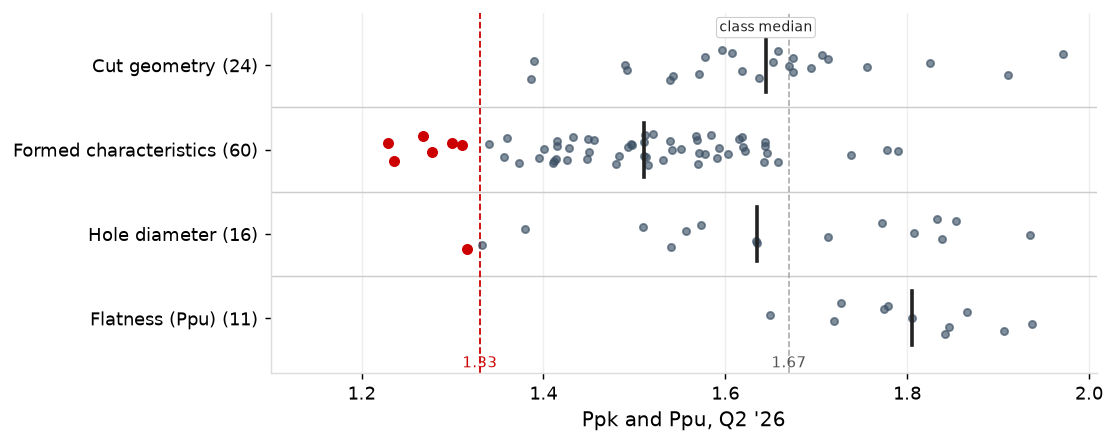
Capability held through the quarter on all but seven critical characteristics. 100 critical characteristics had 60 or more routine subgroups in the quarter; 93 ran at or above Ppk 1.33, and the other seven, six formed characteristics and one hole diameter, ran between 1.23 and 1.32.
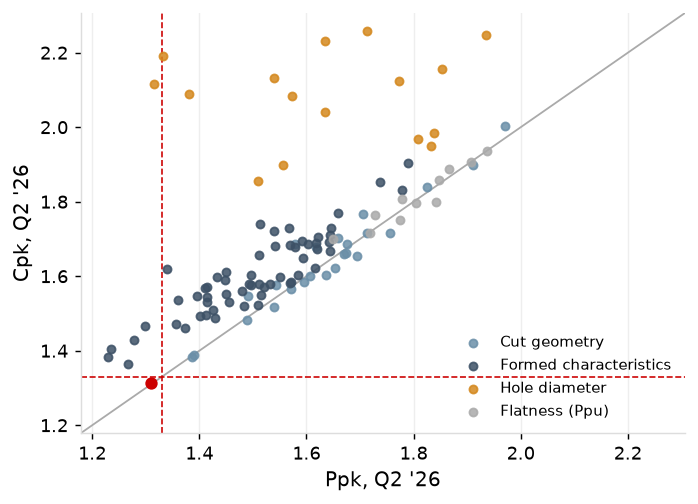
Cpk sits close to Ppk on cut geometry and flatness, and above it by 0.09 on formed characteristics and 0.38 on hole diameters, as expected given the coil offset left after centering and the wear across the sharpening interval. One characteristic, C-16315-06, ran below 1.33 on Cpk, at 1.31.
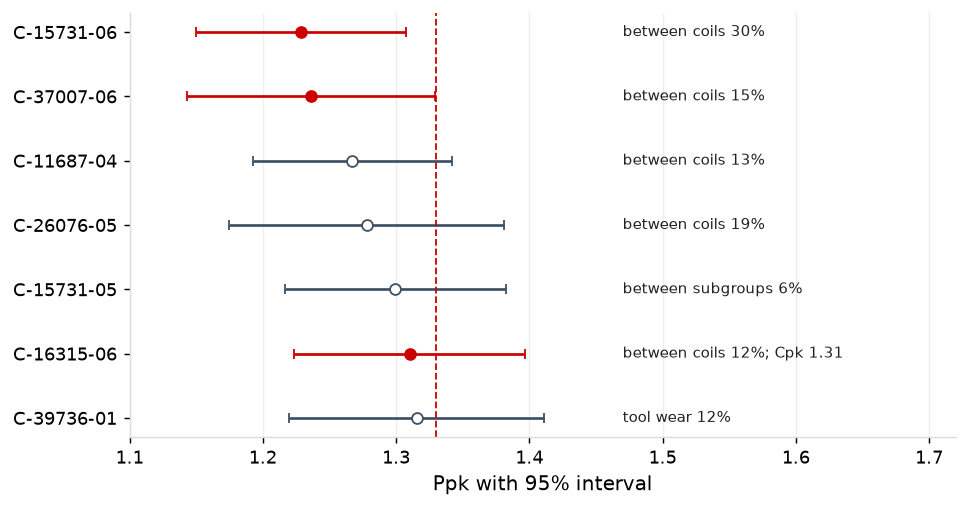
The seven characteristics that ran below 1.33 Ppk in Q2 are shown below, along with their 95% confidence intervals (the estimate of the true Ppk, given the small sample size in Q2). None carries a special cause: each is stable and falls short on its normal variation, so raising its Ppk takes a change to the process.
Three of these characteristics are flagged as needing to be reported to the customer: C-15731-06, C-37007-06, whose Q2 confidence intervals lie wholly below 1.33 Ppk, and C-16315-06, whose Cpk is also below 1.33.
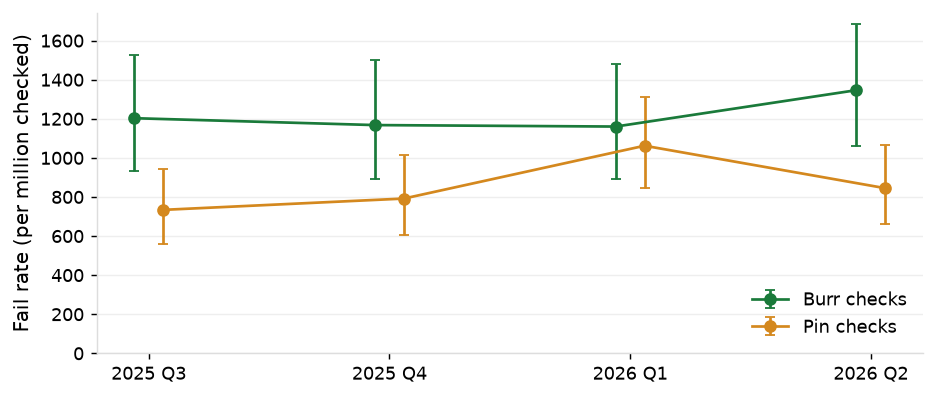
Burr and pin fail rates in Q2 ran within the yearly interval: burr at 1,346 per million pieces checked this quarter against 1,160 to 1,203 before it, and pins at 845 against 734 to 1,062.
3. SPC Review
Signals and Causes
In Q2, the variable characteristic charts (X-bar and R, three-way, and regression) raised 3,396 signals: 18 were the first signal of a special-cause event, 400 followed on from those 18 events (i.e., the charts kept producing signals from the same special cause event), and 2,978 had no assignable cause. The per-stroke tonnage charts signaled 139 times, stopping the press each time, 112 with a special cause finding and 27 with no assignable cause.
The variable characteristic charts traced 18 special causes across Q2, with their timeline laid out below.
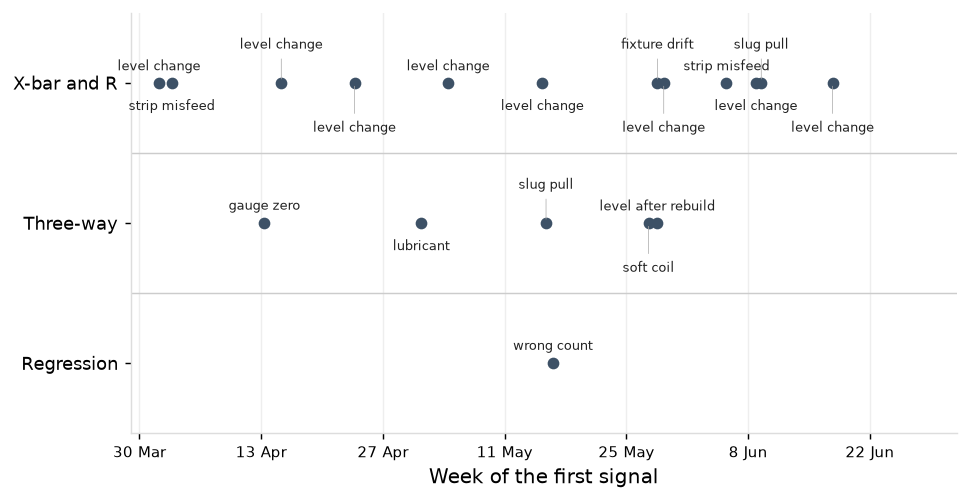
130 signals were traced to a special cause over the quarter. The variable characteristic charts most commonly found special causes related to a die at a new level after sharpening or rebuild (9) and faults related to strip misfeed, slug pull, gauge zeroing, or lubricant issues (6).
| What was caught | Chart | Events | Alarms |
|---|---|---|---|
| Die at a new level after sharpening or rebuild | X-bar and R, three-way | 9 | 379 |
| Fixture drift (F-14026) | X-bar and R, three-way | 1 | 30 |
| Strip misfeed, slug pulling, gauge zeroing, lubricant | X-bar and R, three-way | 6 | 7 |
| Soft coil (C-15731-07) | three-way | 1 | 1 |
| Sharpening logged at the wrong count (PR-06) | regression | 1 | 1 |
| Slug pulling, worn and chipped punches | per-stroke EWMA and channel share | 112 | 112 |
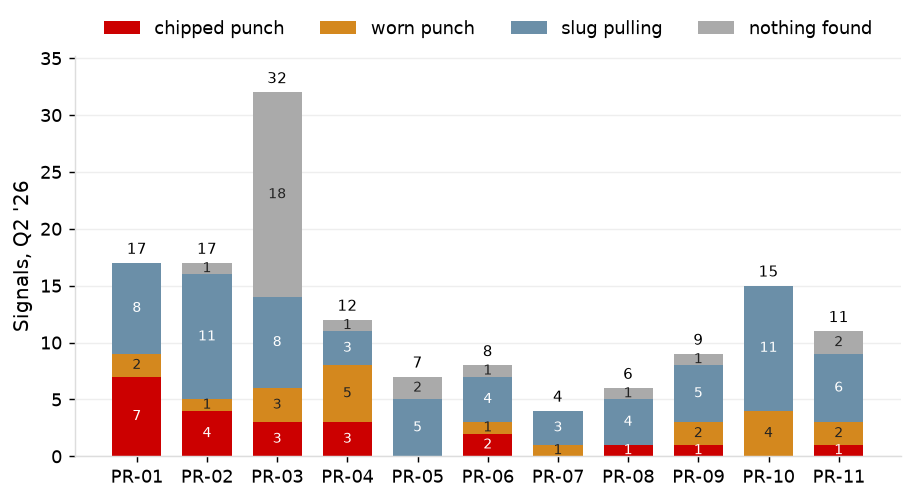
The per-stroke charts stopped the presses on 139 signals across 23.2 million strokes in the quarter. 112 of these signals were found to have a special cause: 68 (61%) due to slug pulling, 23 (21%) due to chipped punches and 21 (19%) due to worn punches. PR-03 carried 18 of the 27 (67%) signals with no assignable cause.
Observed vs. Expectations
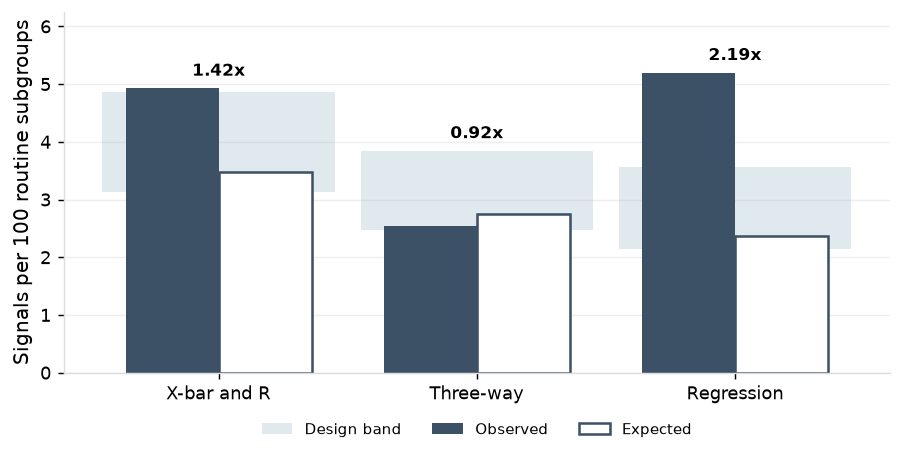
Signals with no assignable cause ran at 1.23 times the expected rate, broadly across the plant. The excess in the quarter was on rules 3 and 4 on the regression and X-bar and R charts. The three-way chart signals were at the bottom of the expected range, and the regression chart signals well above it, as expected and detailed in the SPC Chart Design & Performance report.
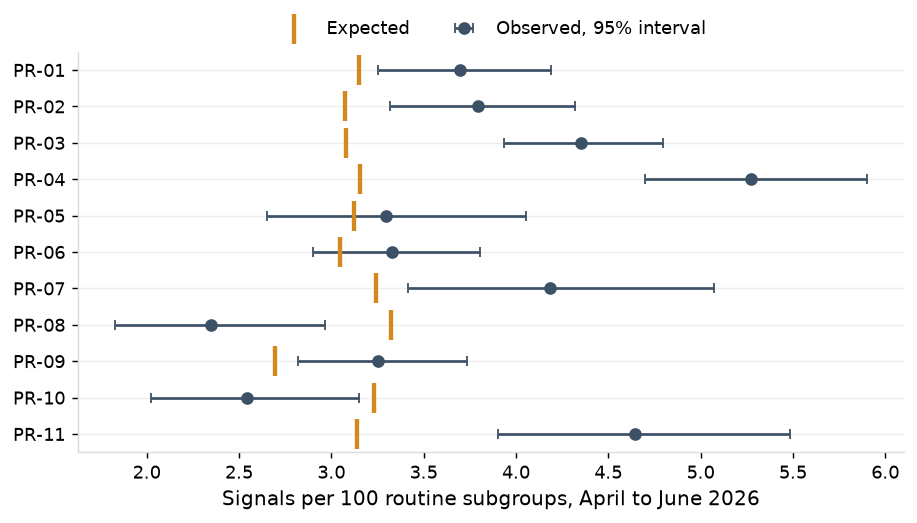
By press, signals with no assignable cause at PR-04, PR-11 and PR-03 ran furthest above expectation, at 1.67, 1.48 and 1.41 times, and PR-08 and PR-10 below it, at 0.71 and 0.79.
Control Limits
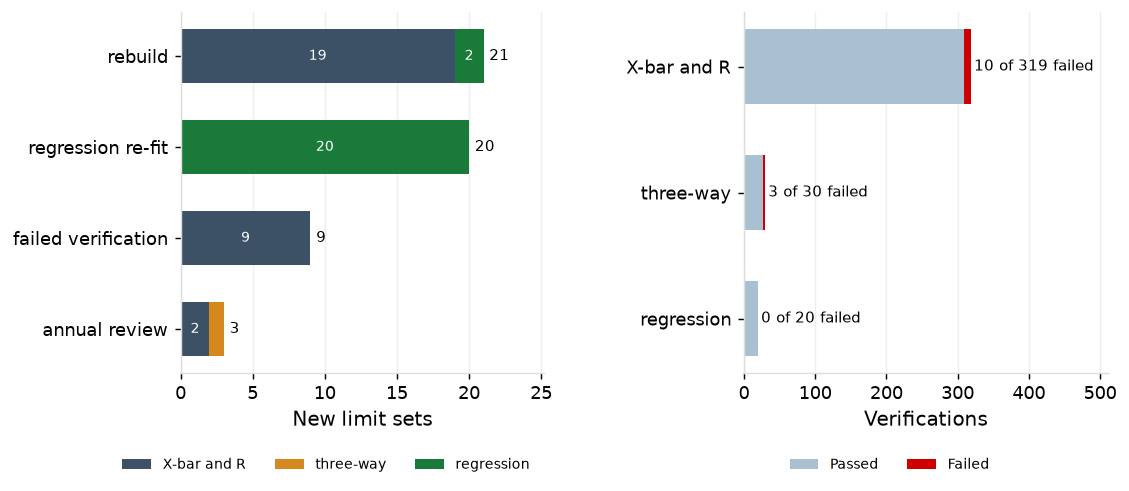
In Q2, 53 new limit sets were issued and 13 of 369 verifications failed. Two baselines are stale: C-23264-03 has been in baseline for 211 days with 21 of 25 subgroups, and C-34479-05 for 103 days with 38 subgroups but three of its ten coil changes.
Measurement Systems
There were 52 fixture studies in the quarter. 44 (85%) had a gauge R&R (%GRR) under the 10% threshold and were within 2.8 points of their previous study. The eight studies that were above the 10% threshold are shown below.